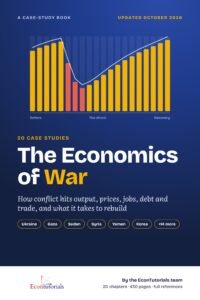
- The IMF finds that output in a country where fighting takes place falls by about 3% when a conflict starts and by about 7% within five years. Losses typically exceed those after financial crises or severe natural disasters.[1][2]
- In about 40% of post-1945 post-conflict episodes, countries fell back into conflict within five years, according to the IMF.[1]
- 90% of the civil wars that began in the 2000s were in countries that had already had a civil war in the previous 30 years (World Bank, 2011).[5]
- Collier and Hoeffler found that a post-conflict country’s capacity to use aid well is no higher than normal in the first three years of peace, but roughly double normal for the rest of the first decade.[3]
- Even the fastest-reforming countries took 15 to 30 years to move from fragile-state institutions to those of a functioning state.[5]
- Aid to Bosnia and Herzegovina and Rwanda averaged about 20% of GDP a year in the first five years of recovery.[1]
- Estimated reconstruction needs: Ukraine almost $588 billion, Syria $216 billion, Gaza about $71.4 billion.[17][18][19]
- Women’s participation increases the probability that a peace agreement lasts 15 years by 35%, according to a UN Women global study.[21]
This final chapter steps back from single wars. The book’s case studies range from the rebuilding of Germany and Japan after 1945 to wars still being fought in October 2026. They differ in almost every way: rich and poor countries, wars between states and civil wars, short wars and wars lasting decades. Yet some patterns repeat. This chapter brings those patterns together with the main research evidence on post-war recovery. It asks three questions. What speeds recovery? What makes it fail? And what should a policymaker do, in what order, when the guns fall silent?
The chapter keeps the same structure as the others, but each section now compares cases. Data come from the World Bank, the IMF and the Maddison Project, whose long-run estimates let us compare recoveries across eight decades. Long-run figures for poor or war-torn countries are rough, and different datasets sometimes disagree; where they do, this chapter says so.
1. Background: how the war began
The wars in this book began for political reasons, but economic conditions shaped the risk. The World Bank’s World Development Report 2011 (WDR 2011) lists economic stresses that raise the risk of conflict: low incomes and therefore a low “opportunity cost” of rebellion, youth unemployment, natural resource wealth, severe corruption and rapid urbanisation.[5] Paul Collier’s research found that a low-income country faces around a 14% risk of civil war in any five-year period, and that reducing dependence on natural resource exports “powerfully reduces the risk of conflict”.[4]
The single strongest predictor of war, however, is a previous war. The WDR 2011 found that the share of new civil wars starting in countries with a previous conflict rose from 43% in the 1960s to 90% in the 2000s.[5] This is the “conflict trap”: war lowers income and weakens institutions, which raises the risk of more war.[4][5]
| War (case) | Fighting | Recovery outcome in brief |
|---|---|---|
| Second World War: West Germany | to 1945 | Currency reform and price decontrol in June 1948; Marshall Plan aid; GDP per head back above its 1938 level by 1954.[8][11][13] |
| Second World War: Japan | to 1945 | Occupation reforms (land reform, breaking up conglomerates); Korean War demand from 1950; GDP per head back above its 1936 level by 1954.[8][12] |
| Korean War: South Korea | 1950–1953 | GDP per head roughly doubled between 1953 and 1969.[8] |
| Vietnam | 1965–1975 (US war years) | A decade of stagnation, then Đổi Mới reforms from 1986.[8][23] |
| Kuwait | August 1990–March 1991 | GDP fell 41% in 1991 and rose 83% in 1992; $52.4bn of UN-administered compensation paid by 2022.[9][14] |
| Rwanda | to 1994 | GDP fell 50% in 1994; aid, stabilisation and institution-building followed.[1][9] |
| Bosnia and Herzegovina | to 1995 | Very high aid, peacekeeping, a 70% cut in debt to private creditors.[1][10] |
| Iraq | 2003 invasion and after | About $60bn of US reconstruction spending, with at least $8bn judged wasted.[15] |
| Afghanistan | 2001–2021 | Aid-dependent state; GDP fell 20.7% in 2021 when aid stopped.[9][16] |
| Syria | From 2011 | Real GDP fell by nearly 53% between 2010 and 2022.[17] |
| Ukraine | From 2014; full-scale from February 2022 | GDP fell 28.8% in 2022; no peace agreement as of October 2026.[9][24] |
| Gaza | October 2023–October 2025 | Ceasefire from 10 October 2025, still fragile a year later.[19][25] |
| Sudan | From April 2023 | GDP fell an estimated 29.4% in 2023; no truce as of late September 2026.[20][26] |
2. Where things stand now
As of October 2026, several of the book’s wars are not over, and recovery has barely begun in others. The IMF’s April 2026 World Economic Outlook notes that in 2024 more than 35 countries experienced conflict on their own territory and that roughly 45% of the world’s population lived in countries affected by conflict.[1]
- Ukraine. There is no general ceasefire or peace agreement. In mid-September 2026 Kyiv said it was preparing for trilateral talks with Russia and the US to resume in October.[24] Reconstruction needs were assessed at almost $588 billion over ten years as of 31 December 2025.[18]
- Gaza. A ceasefire agreed in October 2025 was still formally in place a year later, but without a clear path to a lasting settlement.[19][25] The final UN–EU assessment, prepared with the World Bank, put recovery needs at about $71.4 billion over a decade, with $26.3 billion needed in the first 18 months.[19]
- Sudan. As of late September 2026 there was no truce. The army controlled much of the north, centre and east, and the Rapid Support Forces held large areas in the west.[26] The government said in April 2026 that it wanted to restore its partnership with the World Bank for reconstruction and debt relief.[27]
- Syria. The World Bank published its first post-conflict reconstruction estimate in October 2025: a best estimate of $216 billion, within a range of $140–345 billion.[17]
For students, these live cases make the research in this chapter practical. The question is no longer only “what happened?” but “what should be done next, and in what order?”
3. The economy before the war
Pre-war conditions explain a large part of why some recoveries were fast. Four stand out across the cases.
Human capital and institutions. West Germany and Japan lost much of their physical capital but kept educated workforces, managerial skills and a history of functioning administration. The Solow growth model predicts fast catch-up in that situation, because the return on rebuilding capital is high. On Maddison Project estimates, West German GDP per head in 1946 was 44% of its 1938 level and Japan’s was 70% of its 1936 level; both were back above those pre-war levels by 1954.[8] Vietnam’s bombed districts show a similar pattern at local level: Miguel and Roland found no robust long-run effect of US bombing on poverty, consumption or literacy by 2002.[22]
Income level. Poor countries start with fewer buffers. The WDR 2011 found that a country that experienced major violence between 1981 and 2005 had a poverty rate 21 percentage points higher than a country with no violence.[5]
Natural resources. Resource wealth can fund recovery, as in Kuwait, but it can also fund fighting and weaken the state. Collier found that dependence on primary commodity exports raises conflict risk.[4] The IMF’s 2026 study adds that post-conflict recoveries “tend to stall in commodity-exporting countries”.[1]
Debt. Countries that enter peace with heavy debts have little room to spend on reconstruction. Sudan reached the decision point of the Heavily Indebted Poor Countries (HIPC) debt-relief initiative in June 2021, but the October 2021 coup paused World Bank support. The World Bank says it now has over $60 billion of foreign obligations in arrears, and that completing HIPC would create fiscal space for recovery.[20] Roughly $50 billion of planned debt relief was suspended after the coup.[27]
4. The economic impact: indicator by indicator
4.1 Output and GDP
The first lesson from the cases is that output losses are large and lasting. The IMF’s study of conflicts since 1946 finds that output in conflict-site economies falls by about 3% at the onset of a major conflict and keeps falling, with cumulative losses of about 7% within five years.[1] Cerra and Saxena’s study of a large panel of countries found that “trend output lost is not regained, on average” after wars, crises and other negative shocks.[7] In the worst cases in this book, a single year’s fall was far larger. Real GDP fell 64.0% in Iraq in 1991, 50.2% in Rwanda in 1994, 41.0% in Kuwait in 1991, 29.4% in Sudan in 2023 and 28.8% in Ukraine in 2022.[9]
Recovery, when it comes, is often partial. The IMF finds that when peace is sustained, output rises by about 3.9% five years after the conflict ends, so only about half of the observed loss is made up after five years. When peace is fragile, output does not recover.[1] The cases show both paths. Bosnia’s GDP per head, on Maddison estimates, was 63% of its 1991 level in 1995 and back above it by 1997, helped by very large aid inflows.[8] Vietnam, by contrast, took until 1984 to regain its 1964 level, nine years after the war ended.[8][23]
Data sources disagree for some countries. For Rwanda, World Bank data show GDP per head regained its 1990 level by about 2002, while Maddison estimates show a much slower climb back.[8][9] Both agree on the scale of the 1994 collapse.
Where wars continue, output keeps sliding. Syria’s GDP per head in 2022 was less than half its 2010 level on World Bank data. In Sudan, GDP per head in 2025 was about 60% of its 2022 level.[9]
4.2 Inflation and the currency
War usually brings currency depreciation and inflation. The IMF finds that prices in conflict-site economies rise by about 35% within five years of conflict onset, with exchange-rate depreciation and reserve losses.[1] In the worst cases, inflation turns into hyperinflation, as in Vietnam in 1986, where official sources put inflation at about 774–775%.[23]
How a war is paid for shapes what comes after it. The US financed much of the Vietnam War by borrowing while expanding other spending, and inflation rose through the period; President Nixon then turned to price controls.[28] Stopping inflation early is a common feature of successful recoveries. West Germany’s currency reform of 20 June 1948 replaced the Reichsmark with the Deutsche Mark, converted savings at less than one to ten, and was accompanied by the lifting of most price controls. Goods soon reappeared in shops that had been empty.[13] Vietnam cut inflation to about 8% by 1993 by freeing prices, raising interest rates, limiting subsidies to state firms and devaluing the dong.[23] The IMF’s review of recoveries finds that the level and volatility of inflation were brought down significantly in successful cases, and that stabilisation came early.[1]
4.3 Public finances and debt
War drains public finances: tax collection collapses while defence and humanitarian spending rise.[1][2] After the war, the debt left behind can block recovery. The IMF found that in all but one of its recovery case studies (Nepal), debt restructuring that yielded sizeable debt reductions took place within the first five years of peace. Many of these countries received relief under the HIPC initiative. In Bosnia and Herzegovina, restructuring with private creditors cut the nominal value of outstanding debt by about 70%.[1]
A peace dividend also helps. In the IMF’s recovery cases, military spending fell significantly after peace, creating room for civilian and social spending.[1] Collier warns that high military spending after a conflict actually increases the risk of renewed conflict.[4]
One debt-related lesson cuts the other way. The IMF finds that in countries that relapse into conflict within five years, public expenditure tends to be lower, and it warns that fiscal consolidation after conflict “should not come at the expense of cuts” to productive spending.[1]
4.4 Trade, aid and reconstruction finance
Trade. During major conflicts, exports fall even more than imports, so trade deficits widen and are financed by aid and remittances.[1] In recovery, access to markets matters as much as money. Vietnam’s opening after 1986, and especially after the end of the US embargo in 1994, is the clearest case: exports rose from 6.6% of GDP in 1986 to 98.2% in 2025.[23][29]
Aid. Aid is the main external tool. The cases show how large it can be. Official development aid equalled 59.4% of gross national income (GNI) in Bosnia in 1995, 94.9% in Rwanda in 1994 and about 50% in Afghanistan in 2007–09.[10] The timing matters. Collier and Hoeffler, studying 27 post-conflict countries in the 1990s, found that absorptive capacity (the ability to use extra aid productively) was no greater than normal in the first three years of peace, but roughly double normal in the rest of the first decade. They concluded that aid should be phased in over the decade, but that in practice it had tended to taper off.[3] A later World Bank background paper by Hoeffler and co-authors adds that aid is “only growth enhancing when the violence has stopped”.[6]
The data in the chart show the pattern that Collier and Hoeffler criticised. In Rwanda and Bosnia, aid peaked in the first year and fell sharply within three years, just as absorptive capacity was rising. Afghanistan shows a different problem: aid grew to about half of GNI and stayed there, so the state came to depend on it. When aid was halted in August 2021, grants had been funding about 75% of public spending, and foreign aid was equal to 43% of GDP, according to World Bank figures reported by PBS Frontline.[16] GDP fell 20.7% in 2021 and 6.2% in 2022.[9]
Reconstruction finance and compensation. The Marshall Plan provided over $12 billion for rebuilding Western Europe from 1948.[11] Kuwait was a rare case of compensation from the aggressor: the UN Compensation Commission paid $52.4 billion to more than 1.5 million successful claimants, funded from a share of Iraq’s oil export revenues.[14] In Iraq after 2003, the US spent about $60 billion on reconstruction over nine years. The Special Inspector General for Iraq Reconstruction (SIGIR) presumed at least $8 billion had been wasted and reported Iraqi officials’ complaint that they were excluded from setting priorities.[15] Today’s needs are far larger than past aid flows.
4.5 Labour market
The IMF’s 2026 study finds that recovery after conflict is driven mainly by labour: workers move from military to civilian jobs, and refugees gradually return. Capital stock and productivity stay subdued. Conflicts are associated with about 4% lower capital stock and 3% lower employment five years after onset.[1] The return of displaced people is therefore a core economic policy, not only a humanitarian one. The IMF’s model simulations treat “population recovery” (the gradual return of refugees) as one of the pillars of a strong recovery.[1]
Jobs also matter for peace. The WDR 2011 reports that youth unemployment is “consistently cited” in surveys as a motive for joining rebel movements and gangs, and its central message is that institutions must provide citizen security, justice and jobs to break cycles of violence.[5] The IMF also highlights the reintegration of former combatants, as in Rwanda.[1]
4.6 Poverty, human development and human capital
War pushes people into poverty and keeps them there. The WDR 2011 found that for every three years a country is affected by major violence, poverty reduction lags behind by 2.7 percentage points.[5] In Sudan, the World Bank estimates that extreme poverty nearly doubled, from 33% of the population in 2022 to 71% in 2024.[20] Human capital losses (lost schooling, poorer health and trauma) last for decades. The IMF lists “lost learning, poorer health, diminished economic opportunities” among the lasting human costs that recovery policy must address.[2]
Recovery can also be dramatic. In Vietnam, poverty at the national line fell from 58% in the early 1990s to about 4% by 2022.[29] The WDR 2011 also notes the different burdens on men and women: men make up 96% of detainees and 90% of the missing, while women and children are close to 80% of refugees and internally displaced people.[5]
4.7 Special indicator: relapse risk and institutions
The most important “indicator” after a war may be the probability of another one. Estimates differ, and students should know why. Collier’s 2004 work found that “about half of all post-conflict countries relapse into conflict within a decade”.[4] The IMF’s 2026 study, using a longer sample and a five-year window, finds relapse in about 40% of episodes.[1] The WDR 2011 measures something different: the share of new wars in countries with a past conflict (90% in the 2000s).[5] All three point the same way. Peace is fragile, and the first five years are the most dangerous.
Institutions are slow to build. The WDR 2011 found that even the fastest-transforming countries took between 15 and 30 years to raise institutional performance from that of a fragile state to that of a functioning one.[5] In the IMF’s case studies, governance scores in Côte d’Ivoire, Rwanda and Sri Lanka rose by 40–60% after their conflicts. In Rwanda, a zero-tolerance policy on corruption, an efficient and transparent justice system and a credible public investment strategy helped restore trust.[1]
5. What went well and what went wrong
What speeds recovery
- Durable peace first. The IMF finds that recovery is “conditional on peace”: output rebounds only when peace holds.[1]
- Early, credible stabilisation. West Germany in 1948 and Vietnam after 1989 ended high inflation with a new or devalued currency, free prices and tighter budgets.[13][23] The IMF finds that countries that reduce uncertainty through stabilisation, with lower and less volatile inflation and a stable real exchange rate, recover more strongly.[1]
- Decisive debt relief. Debt reduction within five years was a feature of almost all of the IMF’s successful cases, including the 70% cut in Bosnia.[1]
- Aid that is large, sustained and well timed. Aid of about 20% of GDP a year supported recovery in Bosnia and Rwanda.[1] It is most effective in the middle of the first post-war decade.[3][4]
- Market access and private incentives. Vietnam’s land reform and trade opening, and Germany’s price decontrol, changed incentives quickly at low fiscal cost.[13][23]
- Institution-building and inclusion. Anti-corruption, justice reform, reintegration of former fighters and the participation of women and civil society make peace more durable.[1][21]
- Comprehensive packages. The IMF’s model simulations show that combined policy packages, which reduce uncertainty and rebuild capital together, deliver stronger recoveries than piecemeal measures.[1]
What makes recovery fail
- Relapse. In fragile economies where conflict resumes, recoveries frequently stall.[2]
- Aid that arrives too early and leaves too soon. Collier and Hoeffler found aid tended to taper off when it would have been most useful.[3]
- Aid dependence without a domestic tax base. Afghanistan’s state relied on grants for about three-quarters of its spending; when they stopped, the economy contracted by a fifth in a year.[9][16]
- Reconstruction run from outside. In Iraq, SIGIR reported waste, exclusion of Iraqis from setting priorities, and damage from early decisions such as disbanding the army.[15]
- Ideology over incentives. Vietnam’s collectivisation after 1975 produced a decade of stagnation and hunger before reform.[23]
- Resource dependence. Recoveries stall in commodity exporters, and resource rents can finance renewed fighting.[1][4]
- Unresolved debt. Sudan’s stalled debt relief left it without external finance; the World Bank projects that, even with reforms, output returns to pre-war levels only by 2031, and by 2038 without them.[20]
6. The economics behind it
Hysteresis: why lost output is not regained. Hysteresis means that a temporary shock has permanent effects. If war only destroyed buildings, the Solow model predicts rapid catch-up, as in post-war Germany or Vietnam’s bombed districts.[8][22] If war also destroys institutions, skills and trust, the economy’s long-run path shifts down. Cerra and Saxena’s finding that trend output lost after wars is not regained on average is evidence of hysteresis.[7]
The conflict trap. Low income raises the risk of war; war lowers income and weakens institutions; this raises the risk of more war.[4][5] It is a vicious circle with two stable outcomes: a high-income, peaceful equilibrium and a low-income, violent one. Policy after war aims to push a country over the threshold into the first.
Absorptive capacity and diminishing returns to aid. Absorptive capacity is the amount of extra aid a country can use productively. Just after a war, ministries, contractors and supply chains are weak, so extra money quickly runs into bottlenecks, pushes up local prices and is wasted. As capacity is rebuilt, the return on aid rises. This is why Collier and Hoeffler argue for aid that rises over the first decade rather than peaking at the start.[3]
Dutch disease from aid. “Dutch disease” describes how a large inflow of foreign currency (originally from natural gas in the Netherlands) raises the real exchange rate and damages other export industries. Aid surges can do the same. The IMF found that in most of its recovery cases, aid-related Dutch disease was mitigated, either by “absorbing and spending” aid on imports for reconstruction or by absorbing the foreign exchange without a matching fiscal expansion. It stresses that fiscal and monetary authorities must coordinate.[1]
Sequencing. Sequencing means doing reforms in the right order. The evidence in this book suggests a rough order: security and basic services first; then macroeconomic stabilisation (stop inflation, unify the exchange rate, restore a budget); then debt relief and scaled-up aid; then deeper institutional and structural reform, which takes a generation.[1][3][5] Vietnam’s experience adds that micro-level incentive reforms, such as land rights, can come early because they cost little and pay off fast.[23]
7. Outlook and the way forward
The scale of the task. The reconstruction bills now on the table are without precedent in this book’s cases: almost $588 billion for Ukraine, $216 billion for Syria (about ten times its projected 2024 GDP) and $71.4 billion for Gaza.[17][18][19] This book did not find a comparable published estimate for Sudan. These sums dwarf the $12 billion-plus of the Marshall Plan in nominal terms, although that figure is in 1948 dollars.[11]
Three scenarios for today’s wars.
- Durable peace with a full package. Ceasefires hold, debt is restructured, aid is phased in and refugees return. The IMF’s model suggests reinforcing effects: lower uncertainty brings capital inflows, higher wages and return migration.[1]
- Fragile peace. Fighting stops but uncertainty stays high, aid is limited and institutions are weak. The IMF evidence suggests output then stagnates.[1]
- Relapse or continued war. On the IMF’s estimate, around 40% of post-conflict episodes relapse within five years.[1] Sudan and Ukraine remain at war as of October 2026.[24][26]
A checklist for policymakers. The table brings the lessons together. It is a guide, not a formula: the IMF stresses that conflict settings differ and need country-specific diagnosis.[1]
| Phase | Action | Why (evidence) | Example from the book |
|---|---|---|---|
| Before peace | Plan the economic side of the peace deal: revenue sharing, resource control, reintegration of fighters | Relapse risk is highest in the first five years.[1][4] | Rwanda: reintegration of former combatants[1] |
| Before peace | Include women and civil society in negotiations | Women’s participation raises the chance a deal lasts 15 years by 35%; civil-society participation makes failure 64% less likely.[21] | Gaza, Sudan, Ukraine talks under way[24][26] |
| Year 0–1 | Restore security, basic services and food supply | Aid is only growth-enhancing once violence stops.[6] | Gaza: $26.3bn needed in first 18 months[19] |
| Year 0–2 | Stabilise: credible currency anchor, end monetary financing, unify exchange rates, free prices | Successful recoveries cut the level and volatility of inflation early.[1] | West Germany 1948; Vietnam 1989–93[13][23] |
| Year 0–5 | Restructure debt decisively | Sizeable debt reduction in the first five years in nearly all IMF recovery cases.[1] | Bosnia: ~70% cut in private debt[1] |
| Year 1–10 | Phase aid in and keep it up through the decade | Absorptive capacity roughly doubles after year three.[3] | Aid in Rwanda and Bosnia fell too fast[10] |
| Year 1–10 | Coordinate fiscal and monetary policy to manage aid inflows | Prevents aid-driven Dutch disease.[1] | IMF recovery case studies[1] |
| Year 1–5 | Cut military spending and protect productive and social spending | High post-war military spending raises relapse risk; cuts to productive spending are linked to relapse.[1][4] | Peace dividends in IMF cases[1] |
| Year 1–5 | Give people incentives: land and property rights, open markets, easy business entry | Cheap, fast supply-side gains.[23] | Vietnam: household farming, rice exports by 1989[23] |
| Year 1–10 | Help refugees and displaced people return; create jobs for young people | Recovery is labour-driven; youth unemployment fuels violence.[1][5] | Sudan, Ukraine, Syria[1] |
| Year 1–30 | Build institutions: anti-corruption, justice, public investment management, statistics | Takes 15–30 years even for the fastest reformers.[5] | Rwanda governance reforms[1] |
| Ongoing | Let national authorities set reconstruction priorities; audit spending | Outside-led spending risks waste.[15] | Iraq: at least $8bn presumed wasted[15] |
| Ongoing | Diversify away from resource dependence; manage resource revenue transparently | Recoveries stall in commodity exporters.[1] | Sudan gold and oil; Iraq oil[1][4] |
| Ongoing | Build a domestic tax base so the state can survive the end of aid | Aid dependence makes the economy fragile when aid stops.[16] | Afghanistan 2021[9][16] |
A final word. The economics of war is in the end the economics of choices: how to pay for a war, how to stop it and how to rebuild after it. The cases in this book show that wars destroy more than buildings. They destroy trust, institutions and years of schooling, and that is why recovery takes so long. But they also show that recovery is possible. West Germany rebuilt within a decade; Vietnam went from hyperinflation to upper-middle-income status within forty years.[8][29] What made the difference, in almost every case, was durable peace, sound macroeconomic policy and institutions that people trusted.
8. Exam-style questions
MediumQ1. Explain what is meant by the “conflict trap” and why it makes post-war recovery difficult. Show answer guide
MediumQ2. Using the concept of absorptive capacity, explain why aid might be more effective five years after a war than in the first year. Show answer guide
MediumQ3. With the help of a diagram, explain the difference between full recovery and a permanent output loss after a war. Show answer guide
ExamQ4. Evaluate the view that large reconstruction aid is the most important factor in a country’s economic recovery after war. Show answer guide
Glossary
- Conflict trap: a vicious circle in which poverty and weak institutions raise the risk of war, and war deepens poverty and weakens institutions.
- Relapse: a return to armed conflict after a period of peace.
- Absorptive capacity: the amount of extra aid or investment an economy can use productively.
- Hysteresis: when a temporary shock has permanent effects on the level of output.
- Macroeconomic stabilisation: policies to bring down inflation, stabilise the exchange rate and restore a sustainable budget.
- Sequencing: the order in which reforms are introduced.
- Debt restructuring: changing the terms of a country’s debt, often including a reduction in the amount owed.
- HIPC initiative: the Heavily Indebted Poor Countries initiative of the IMF and World Bank, which cancels debts of qualifying poor countries.
- Dutch disease: damage to export industries caused when a large inflow of foreign currency raises the real exchange rate.
- Peace dividend: resources freed for civilian use when military spending falls after a war.
- Rapid Damage and Needs Assessment (RDNA): a joint estimate, usually by the World Bank, UN and EU, of war damage and the cost of recovery.
- Gross national income (GNI): GDP plus net income received from abroad.
References
- International Monetary Fund (2026). “The Macroeconomics of Conflicts and Recovery”, Chapter 3 in World Economic Outlook, April 2026: Global Economy in the Shadow of War. IMF, April 2026. https://www.imf.org/-/media/Files/Publications/WEO/2026/April/English/ch3.pdf
- Balima, H., Lagerborg, A. and Weaver, E. (2026). “Wars Impose Lasting Economic Costs, While More Defense Spending Means Hard Choices”. IMF Blog, 8 April 2026. https://www.imf.org/en/blogs/articles/2026/04/08/wars-impose-lasting-economic-costs-while-more-defense-spending-means-hard-choices
- Collier, P. and Hoeffler, A. (2002). “Aid, Policy, and Growth in Post-Conflict Societies”. World Bank Policy Research Working Paper No. 2902, October 2002. https://openknowledge.worldbank.org/entities/publication/9b49f4e8-0011-547e-9e69-b55cdc013822
- Collier, P. (2004). “Development and Conflict”. Centre for the Study of African Economies, University of Oxford, 1 October 2004 (UN DESA). https://www.un.org/esa/documents/Development.and.Conflict2.pdf
- World Bank (2011). World Development Report 2011: Conflict, Security, and Development (Overview, Table F1.1 and Feature 1). World Bank, April 2011. https://openknowledge.worldbank.org/handle/10986/4389
- Hoeffler, A., Ijaz, S. S. and von Billerbeck, S. (2011). “Post-Conflict Recovery and Peacebuilding”. Background paper for the World Development Report 2011. World Bank. https://openknowledge.worldbank.org/handle/10986/9184
- Cerra, V. and Saxena, S. C. (2007). “Growth dynamics: the myth of economic recovery”. BIS Working Paper No. 226, Bank for International Settlements, March 2007. https://www.bis.org/publ/work226.htm
- Bolt, J. and van Zanden, J. L. (2024). Maddison Project Database, version 2023 (GDP per capita in 2011 US$). Groningen Growth and Development Centre, University of Groningen. Indices calculated by the author. https://dataverse.nl/api/access/datafile/421302
- World Bank (2026). World Development Indicators: “GDP growth (annual %)” NY.GDP.MKTP.KD.ZG and “GDP per capita (constant 2015 US$)” NY.GDP.PCAP.KD for Afghanistan, Bosnia and Herzegovina, Iraq, Kuwait, Rwanda, Sudan, Syria, Ukraine and West Bank and Gaza. Accessed 14 October 2026. https://api.worldbank.org/v2/country/RWA;BIH;KWT;IRQ;AFG;SYR;UKR;PSE;SDN/indicator/NY.GDP.MKTP.KD.ZG?format=json&date=1990:2025&per_page=1000
- World Bank (2026). World Development Indicators: “Net ODA received (% of GNI)” DT.ODA.ODAT.GN.ZS. Accessed 14 October 2026. https://api.worldbank.org/v2/country/RWA;BIH;AFG/indicator/DT.ODA.ODAT.GN.ZS?format=json&date=1990:2023&per_page=1000
- Office of the Historian, US Department of State. “Marshall Plan, 1948”. Milestones in the History of U.S. Foreign Relations. Accessed 14 October 2026. https://history.state.gov/milestones/1945-1952/marshall-plan
- Office of the Historian, US Department of State. “Occupation and Reconstruction of Japan, 1945–52”. Milestones in the History of U.S. Foreign Relations. Accessed 14 October 2026. https://history.state.gov/milestones/1945-1952/japan-reconstruction
- Nagel, J. (2023). “The economic and currency reform of 1948: the basis for stable money”. Deutsche Bundesbank, guest contribution, 28 August 2023. https://bundesbank.de/en/press/contributions/the-economic-and-currency-reform-of-1948-the-basis-for-stable-money-915302
- United Nations Geneva (2022). “United Nations Compensation Commission pays out final compensation award”. Press release, 13 January 2022. https://www.ungeneva.org/en/news-media/press-release/2022/01/united-nations-compensation-commission-pays-out-final-compensation
- McDermid, C. (2013). “US ‘shock and audit’ over Iraq expenses” (on SIGIR’s final report, Learning From Iraq). Al Jazeera, 27 March 2013. https://www.aljazeera.com/features/2013/3/27/us-shock-and-audit-over-iraq-expenses
- Boghani, P. (2021). “Taliban Takeover: How Frozen Assets, Foreign Aid Impacts Afghanistan”. PBS Frontline, 12 October 2021. https://www.pbs.org/wgbh/frontline/article/taliban-takeover-how-frozen-assets-foreign-aid-impacts-afghanistan
- World Bank (2025). “Syria’s Post-Conflict Reconstruction Costs Estimated at $216 Billion”. Press release, 21 October 2025. https://www.worldbank.org/en/news/press-release/2025/10/21/syria-s-post-conflict-reconstruction-costs-estimated-at-216-billion
- World Bank (2026). “Updated Ukraine Recovery and Reconstruction Needs Assessment Released” (RDNA5). Press release 2026/ECA/039, 23 February 2026. https://www.worldbank.org/en/news/press-release/2026/02/23/updated-ukraine-recovery-and-reconstruction-needs-assessment-released
- AFP, via The Defense Post (2026). “Over $71B Needed Over Next Decade to Rebuild Gaza: UN, EU” (on the final Gaza Rapid Damage and Needs Assessment). 20 April 2026. https://thedefensepost.com/2026/04/20/gaza-war-rebuild-cost/
- World Bank (2025). “Sudan Economic Update 2025: The Economic and Social Consequences of the Conflict: Charting a Path to Recovery”. World Bank, May 2025. https://documents1.worldbank.org/curated/en/099051925180542315/text/P178527-6a7d4d70-52be-49b7-87e5-ead89050a99b.txt
- UN Women (2015). “Preventing Conflict, Transforming Justice, Securing the Peace: A Global Study on the Implementation of United Nations Security Council Resolution 1325” — fact sheet and key messages. UN Women, 2015. https://wps.unwomen.org/resources/fact-sheets/Fact-Sheet-and-Key-messages-Global-Study-EN.pdf
- Miguel, E. and Roland, G. (2006). “The Long Run Impact of Bombing Vietnam”. NBER Working Paper 11954, January 2006. https://www.nber.org/papers/w11954
- International Monetary Fund (2018). “Vietnam: Raising Millions Out of Poverty”, August 2018 https://www.imf.org/en/Countries/VNM/vietnam-raising-millions-out-of-poverty; and Kirk, M. and Nguyen Do Anh Tuan (2009). “Exiting from Collective Agriculture: Land-tenure reform in Vietnam”, in Millions Fed, IFPRI https://cgspace.cgiar.org/server/api/core/bitstreams/301e0f9a-e64a-4bc7-9a7e-e0feacac131a/content
- Reuters, via Global Banking & Finance Review (2026). “Kyiv preparing for talks to resume in October, senior Ukrainian official says”. 12 September 2026. https://www.globalbankingandfinance.com/kyiv-preparing-talks-resume-october-senior-ukrainian/
- CGTN (2026). “One year after Gaza ceasefire: A truce without a clear path to peace”. 11 October 2026. https://news.cgtn.com/news/2026-10-11/One-year-after-Gaza-ceasefire-A-truce-without-a-clear-path-to-peace-1R9rFr8WC5y/share_amp.html
- Hikmat, F. (2026). “Sudan’s hope – next humanitarian truce: the ceasefire is only half the negotiation” (opinion). Sudan Tribune, 29 September 2026. https://sudantribune.com/?p=319386
- Sudan Tribune (2026). “Sudan seeks to restore World Bank partnership for reconstruction and debt relief”. 18 April 2026. https://sudantribune.com/?p=312963
- Congressional Research Service (2008). “Financing Issues and Economic Effects of American Wars” (RL31176). CRS, 29 July 2008. https://www.everycrsreport.com/reports/RL31176.html
- World Bank (2026). “Viet Nam: Overview” (updated 28 September 2026) https://www.worldbank.org/en/country/vietnam/overview; and World Development Indicators for Viet Nam: SI.POV.NAHC and NE.EXP.GNFS.ZS, accessed 14 October 2026 https://api.worldbank.org/v2/country/VNM/indicator/SI.POV.NAHC?format=json&date=1990:2025