
There are few things we need to consider before discussing the supply curve. Supply and demand analysis can:
- Help us understand and predict how real world economic conditions affect market price and production
- Analyze the impact of government price controls, minimum wages, price supports, and production incentives on the economy
- Determine how taxes, subsidies, tariffs and import quotas affect consumers and producers.
The Supply Curve
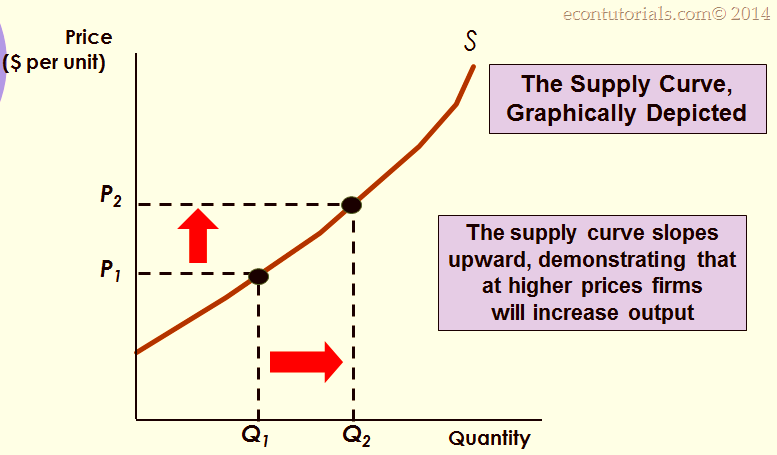
The relationship between the quantity of a good that producers are willing to sell and the price of the good.
It Measures quantity on the x-axis and price on the y-axis. Mathematically:

Graphically:
Factors Effecting Supply Curve
Just like demand which is effected by internal and external Factors. So is the Supply.
- Costs of Production
- Technology
- Cost of Production
- Labor
- Capital
- Raw Materials
Lower costs of production allow a firm to produce more at each price and vice versa.

The cost of raw materials falls
- At first Production is Q1 at P1 and Q0 at P2
- Now after the cost of raw material decreases. Production is Q2 at P1 and Q1 at P2
- Supply curve shifts right to S’.
Same is the Case for Technology. An enhancement in Technology leads to cost effective production due to which the Supply Curve Shifts rightward. As a result, the QS increase and price and Vice Versa.
Change in Supply and Change in Quantity Supplied
Change in Quantity Supplied
- Movement along the curve caused by a change in price. In other words, thee is only a change in Quantity Supplied when prices changes. Or Factors within the Graph (Price).
Change in Supply
- Shift of the curve caused by a change in something other than the price of the good would result in a change in Supply. Just like we described Technology and cost of Production that effect Supply Curve other than Price.