Description
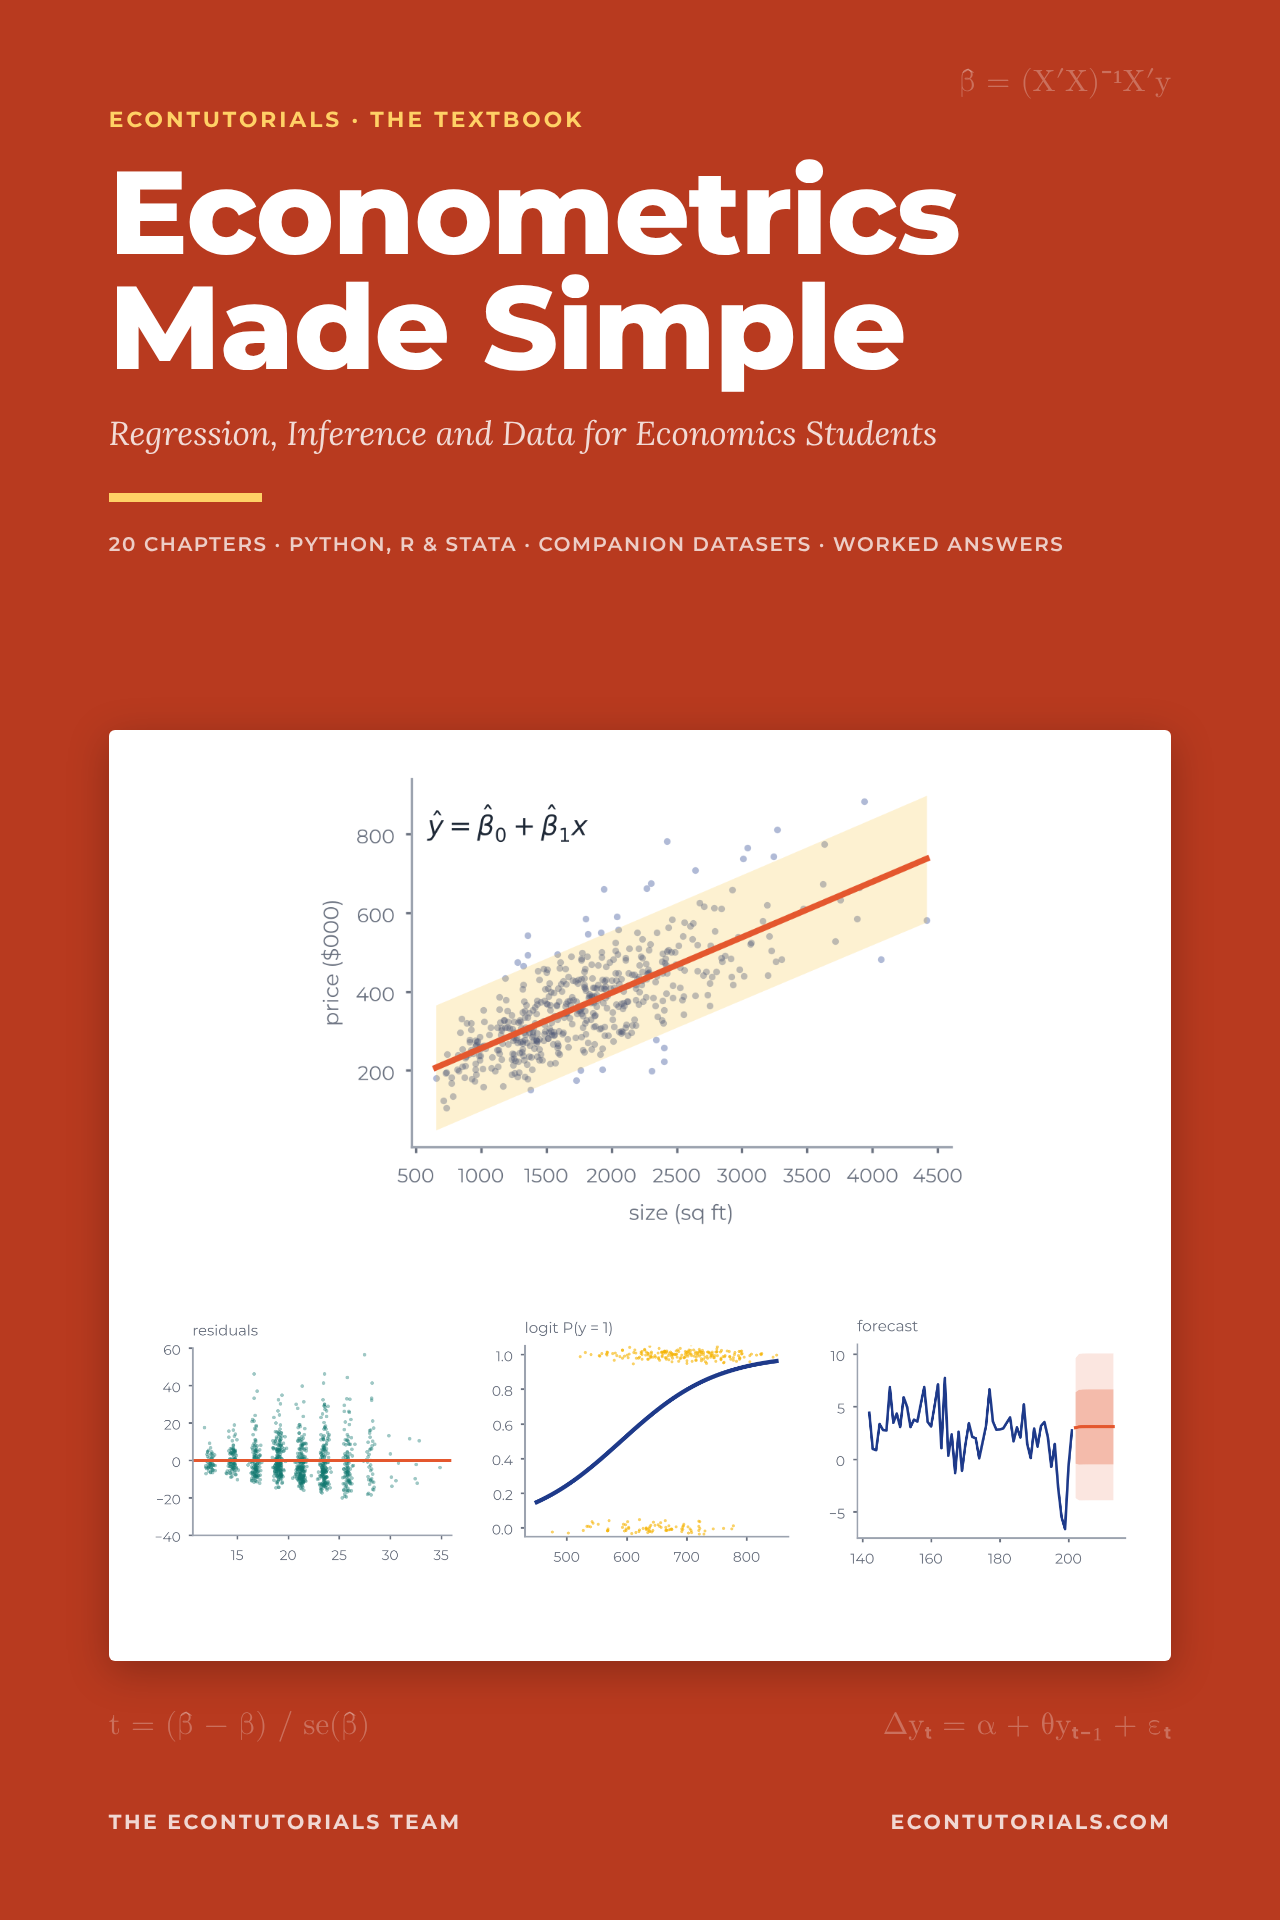
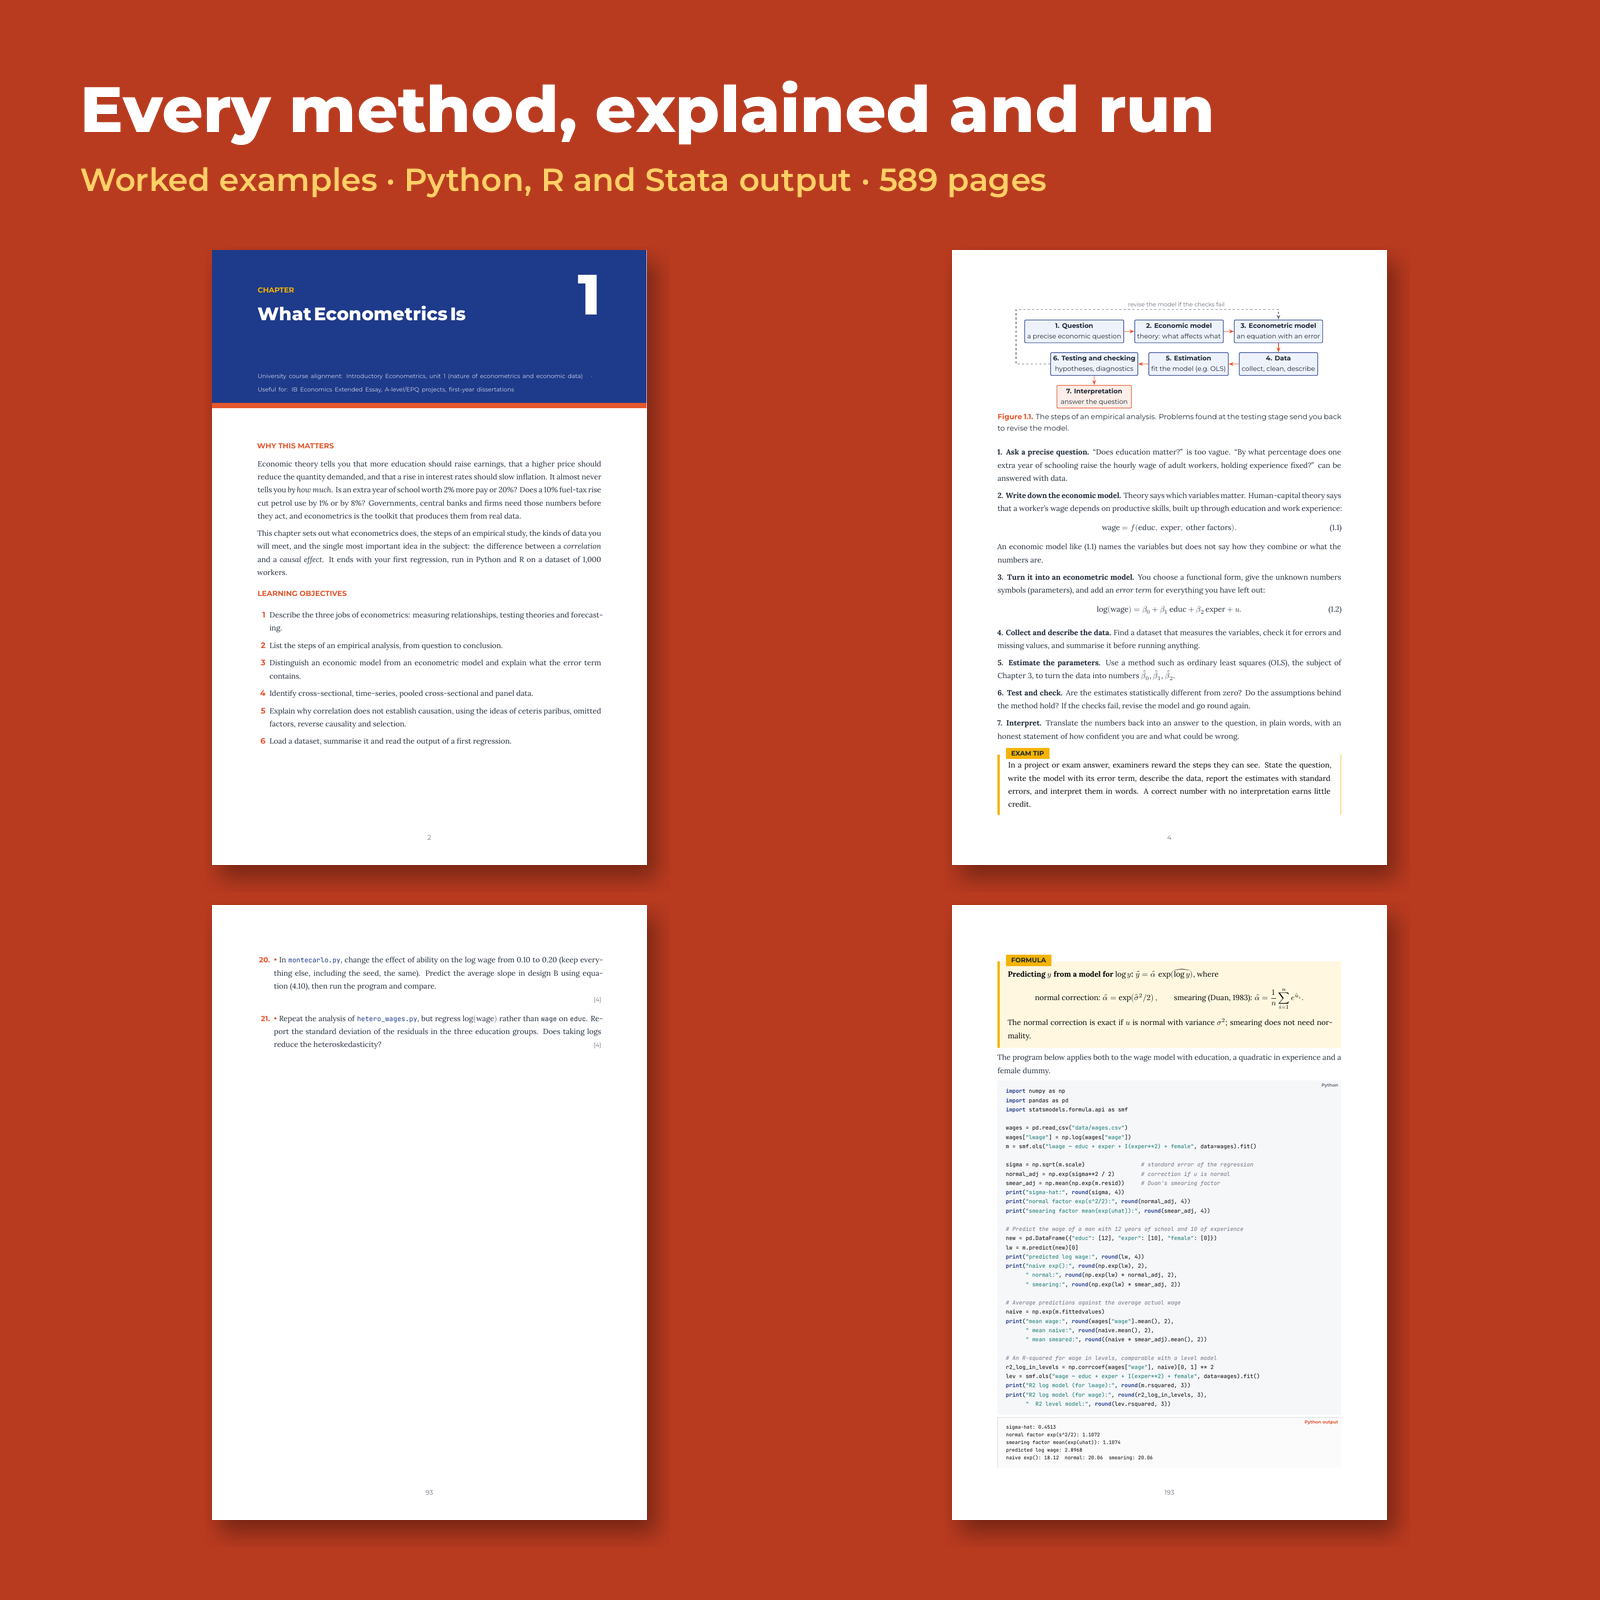
Econometrics is where economics students meet real data, and where many of them get lost: the notation is heavy, the textbooks are long, and the step from the formula to the software output is never shown. This econometrics textbook closes that gap. Each idea starts with the question it answers, is explained in short sentences, and then is run on data you can download, in Python, R and Stata, with the real output in the book and a line-by-line reading of what it means.
What this econometrics textbook covers
- Part I — Foundations (Chapters 1–4). What econometrics is and the kinds of data it uses; a review of probability, distributions, expectations and sampling; simple regression and ordinary least squares (OLS); the properties of OLS, unbiasedness, variance and the Gauss–Markov theorem.
- Part II — Multiple Regression (Chapters 5–10). t tests, p-values and confidence intervals; multiple regression and omitted variable bias; F tests and joint hypotheses; logs, quadratics and interactions; dummy variables and the Chow test; model specification, R-squared vs adjusted R-squared, and multicollinearity.
- Part III — When the Assumptions Fail (Chapters 11–13). Heteroskedasticity (Breusch–Pagan and White tests, robust standard errors, WLS); autocorrelation (Durbin–Watson, Breusch–Godfrey, Newey–West); endogeneity, instrumental variables and two-stage least squares, with weak-instrument and over-identification tests.
- Part IV — Special Data and Models (Chapters 14–16). Linear probability, logit and probit models with marginal effects; panel data, fixed effects, random effects and the Hausman test; difference-in-differences and regression discontinuity.
- Part V — Time Series and Projects (Chapters 17–20). Time-series regression, trends and seasonality; stationarity and the augmented Dickey–Fuller test; forecasting, ARIMA, cointegration and error-correction models; and a step-by-step guide to doing and writing up an empirical project.
- Appendices. A: software quick reference for Python, R and Stata. B: statistical tables (t, chi-squared, F, Durbin–Watson). C: the matrix form of OLS. D: a complete formula sheet.
Learn it in the software you will use
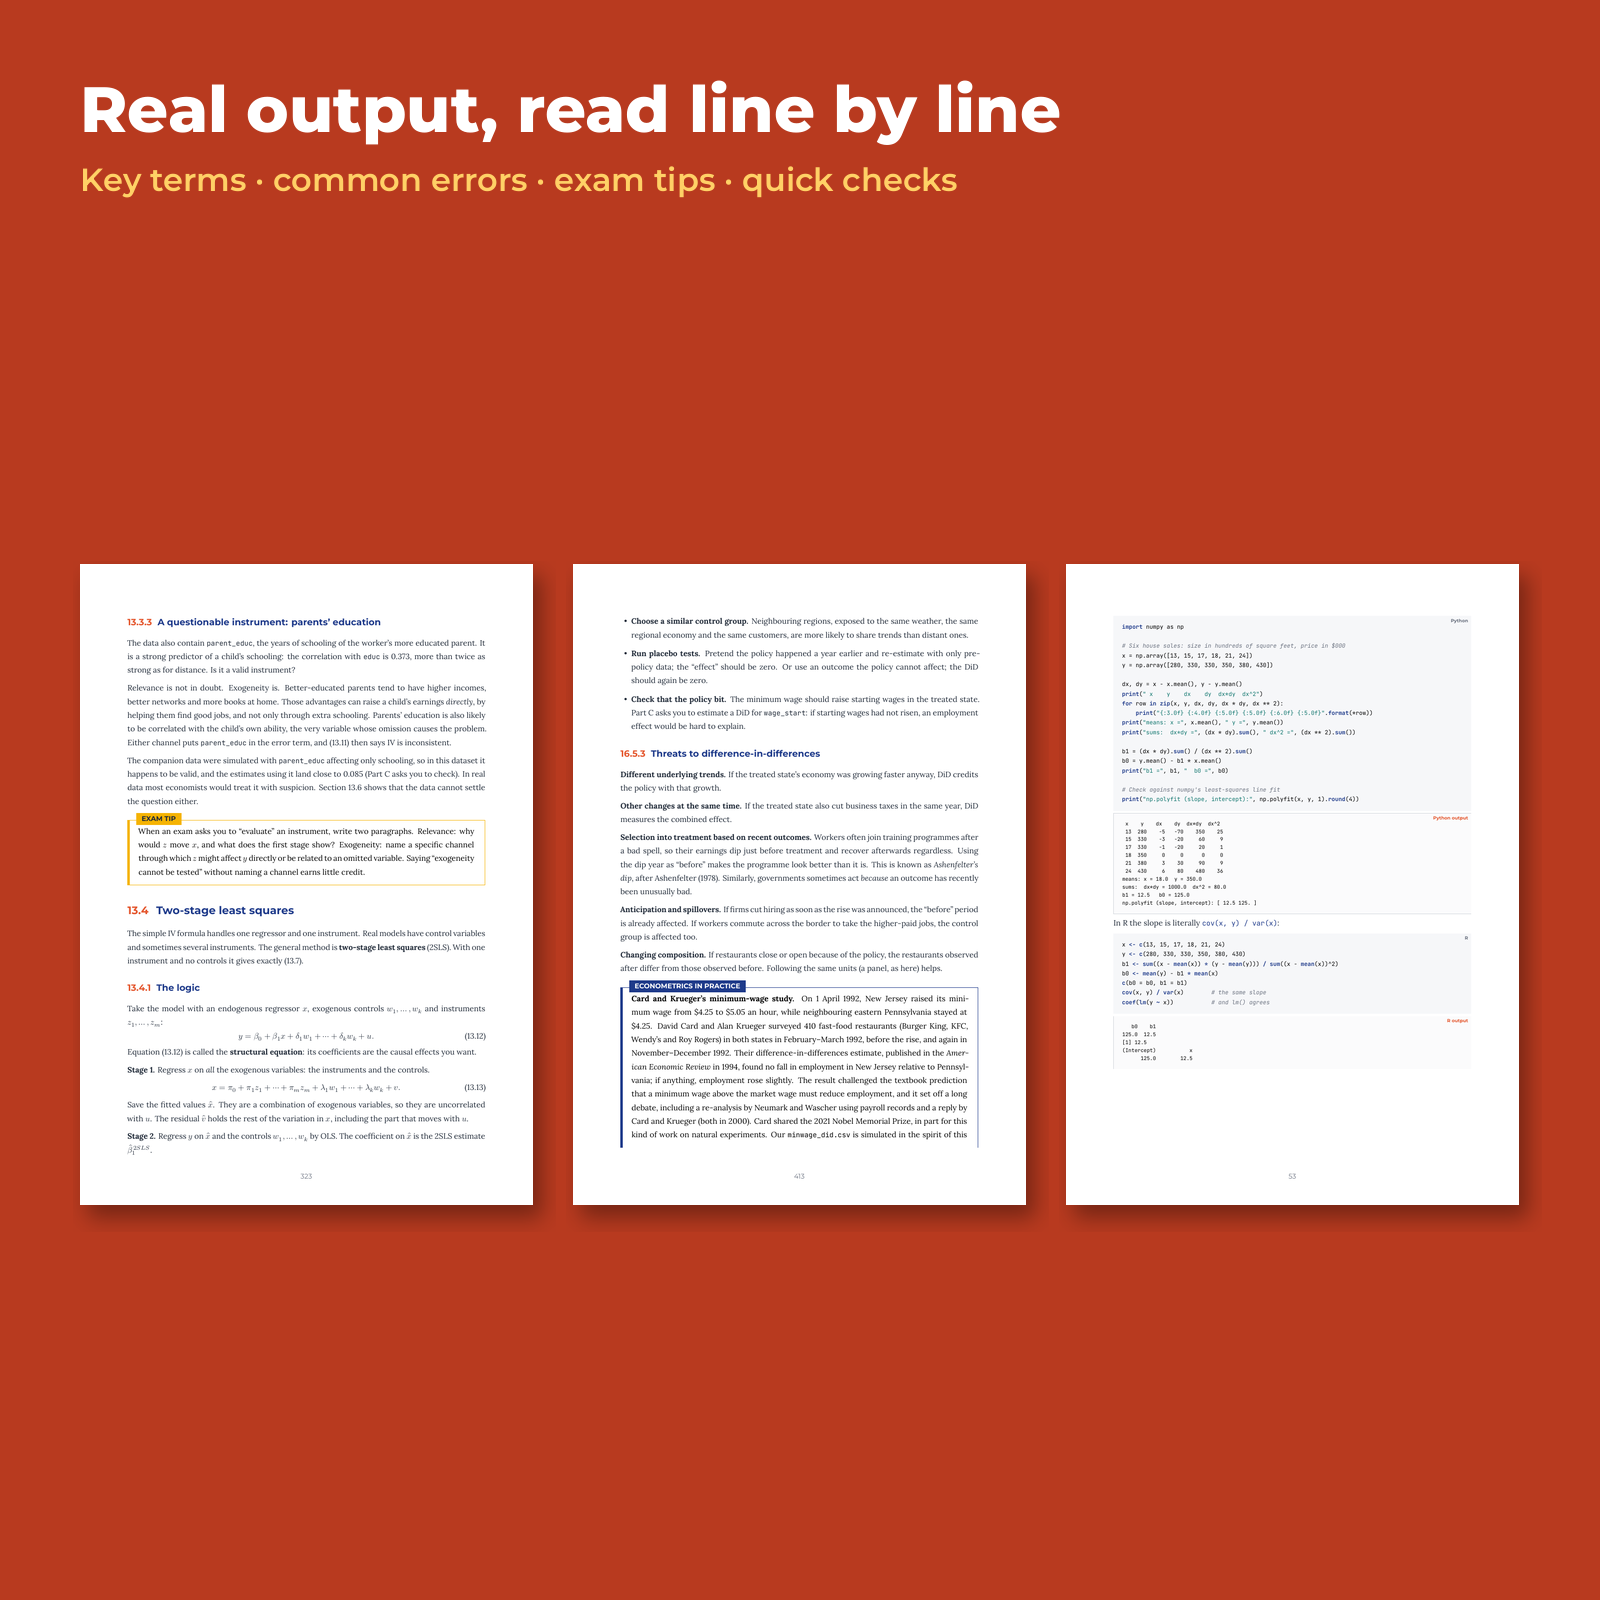
Your course may use Stata, R or Python. This book shows all three side by side for every analysis, so you can follow along in whatever your module uses and move between them later. Every script was run to produce the book, and every number printed in the text is checked by computer against that output.
Built for exams and coursework
Each chapter has learning objectives, key-term boxes, formula boxes, common-error warnings, exam tips, quick checks and a chapter summary, followed by multiple-choice, short-answer and software questions with full worked answers. It suits first and second-year undergraduate econometrics modules, A Level and IB students writing an extended essay with data, and anyone who needs regression for a dissertation.
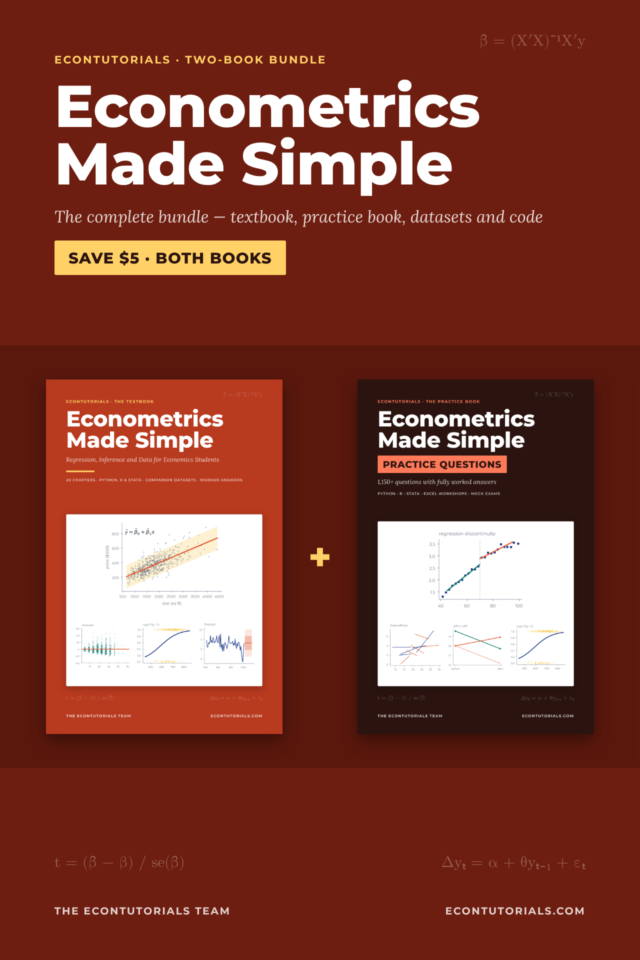
New to statistics? Start with Statistics Made Simple. Want more practice? The practice book adds 1,161 questions, and the bundle gives you both for $19. The free econometrics step-by-step guide follows the same 20 chapters.
Instant download: the full book as a PDF, each chapter as its own PDF, and a ZIP of all datasets and Python, R and Stata code.