
Statistics · Inference
How to Interpret a Confidence Interval (Without Getting It Wrong)
“95% confident” does not mean what you think, and the wrong version costs marks in every stats department on earth. Here’s the interpretation that’s actually correct.
Your output says the 95% confidence interval for the mean is [4.2, 5.8]. So there’s a 95% chance the true mean is between 4.2 and 5.8, right?
Wrong. And it’s the single most common interpretation, made by textbooks, journalists, and a fair number of professors. The correct reading is subtler, and once you get it, confidence intervals become one of the most useful tools you own — more honest than a p-value, and far more informative.
Why “95% chance the mean is inside” is wrong
The true mean is a fixed number. It’s already either inside your interval or outside it — there’s no probability about it. The dice have already been rolled; the mean isn’t moving.
So where does the 95% live? In the method, not the interval. It describes how the procedure behaves over many repetitions.
🔑 Key term — the correct interpretation
A 95% confidence interval means: if you repeated the entire study many times, building an interval each time, about 95% of those intervals would contain the true parameter. The randomness is in the interval you construct, not in the fixed parameter it’s trying to catch.
💡 Insight — the net, not the fish
Think of the true mean as a fish sitting still on the seabed. Each study casts a net (an interval). Your net either caught the fish or it didn’t — that’s already settled.
The “95%” describes your net-casting technique: it’s a method that catches the fish 95% of the times you use it. You just can’t know whether this particular cast was one of the successes. That’s why we say “95% confident” — confident in the method, agnostic about this one result.
The sentence that earns full marks: “We are 95% confident that the true [parameter, named, with units] lies between [a] and [b].” Notice it never says “probability.”
💡 Insight — the objection you’re about to raise is a good one
Students always want to say “there’s a 95% probability the mean is in here,” because that’s the genuinely useful statement. You’re right that it’s what you’d love to say — it just requires a different framework (Bayesian statistics, with a “credible interval” and a prior). Within the standard frequentist framework you’re being taught, the probability statement isn’t available. Your instinct isn’t stupid; it’s aimed at the wrong toolbox.
What the width tells you, and why it beats a p-value
A p-value gives you a yes/no verdict. A confidence interval gives you a range of plausible values — which is almost always more useful, because it tells you both whether there’s an effect and how big it might be.
📐 Formula — the anatomy
estimate ± (critical value) × (standard error)
Every confidence interval has this shape. The width is controlled by three things: your confidence level (higher confidence → wider), the variability in your data, and your sample size (bigger n → narrower, via the standard error). Want a tighter interval? The reliable lever is more data.
💡 Insight — the zero test
For an interval estimating a difference (between two groups, or a regression slope), one question does a lot of work: does the interval contain zero?
If it does, you can’t rule out “no difference” — the result is not significant at that level. If it doesn’t, it is. But the interval tells you more than the p-value ever would: a difference interval of [0.1, 0.2] and one of [0.1, 45] are both “significant,” yet the second is nearly useless because the effect could be trivial or enormous. The width is the information the p-value throws away.
⚠ Common errors
“95% of the data falls in this interval.” No — that would be a different interval entirely. The confidence interval is about the mean, not the spread of individual observations.
“These two intervals overlap, so the groups aren’t different.” Overlapping confidence intervals do not reliably imply no significant difference. To compare two groups, test the difference directly — eyeballing overlap is a real, well-documented mistake.
“A 99% interval is better than a 95% one.” It’s more confident but wider — less precise. There’s a trade-off: certainty costs precision. 95% is convention because it’s a reasonable balance, not because it’s optimal.
Practice questions
Q1. A 95% CI for mean height is [168cm, 172cm]. Write a correct one-sentence interpretation.
Q2. A student says “95% of people are between 168 and 172cm.” What’s wrong?
Q3. A 95% CI for a treatment’s effect on recovery time is [−0.5 days, +3.2 days]. Is the effect statistically significant at 5%? What can and can’t you conclude?
Q4. You recompute the same interval at 99% confidence. Will it be wider or narrower? Why might you still prefer 95%?
Worked answers
A1. “We are 95% confident that the true mean height of the population lies between 168 and 172cm.” No “probability,” no claim about individuals.
A2. The interval is about the mean, not the spread of people. Individual heights vary far more widely — that would be described by the standard deviation, giving a much broader range. The student has confused an interval for the average with the distribution of individuals.
A3. The interval contains zero (it runs from −0.5 to +3.2), so the effect is not statistically significant at 5%. What you can conclude: the data are compatible with anything from a small harm to a moderate benefit. What you can’t conclude: that the treatment has no effect — the interval leans positive and a real benefit up to 3.2 days is entirely plausible. This is a “not enough evidence” result, not a “no effect” result.
A4. Wider. To be more confident of catching the true value, you must cast a bigger net. You might still prefer 95% because the 99% interval is so wide it may be uninformatively vague — precision and confidence trade off, and 95% is the conventional sweet spot.
The short version
• The parameter is fixed. The interval is random. The 95% describes the method.
• Correct phrasing: “we are 95% confident the true [parameter] lies between a and b.” Never “probability.”
• The width is the information a p-value throws away — use it.
• Contains zero → not significant. But that’s not proof of no effect.
• Higher confidence = wider = less precise. There’s always a trade-off.
The engine inside every interval is the standard error, and intervals are the honest cousin of the p-value.
References
1. Cumming, G. (2014) “The New Statistics: Why and How,” Psychological Science, 25(1), pp. 7–29.
2. Morey, R.D. et al. (2016) “The fallacy of placing confidence in confidence intervals,” Psychonomic Bulletin & Review, 23, pp. 103–123.
Confidence intervals get the careful treatment in Statistics Made Simple.
Including the honest footnote most courses skip: why your instinct about “probability” points at Bayesian statistics.
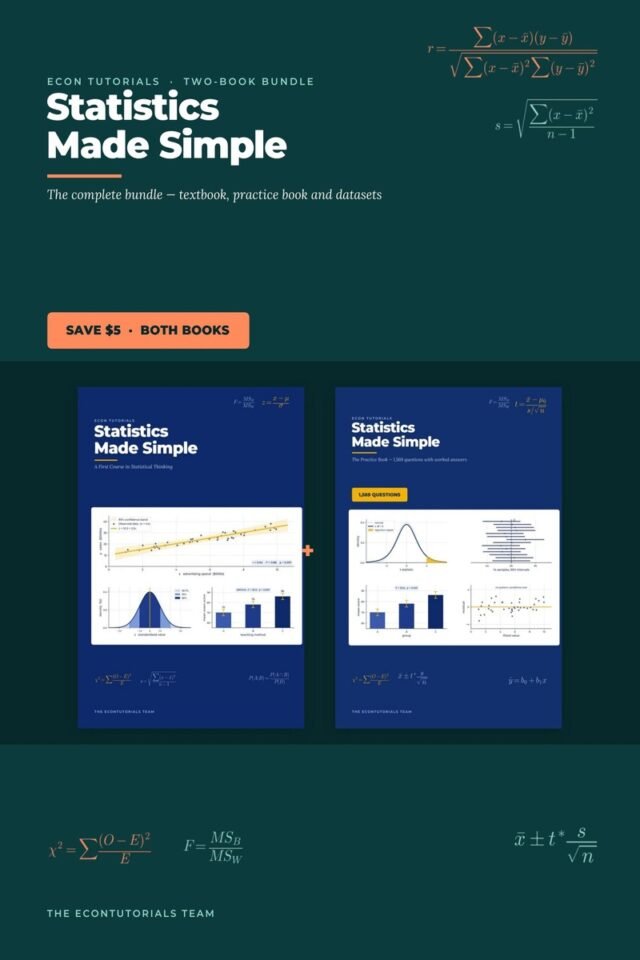
This topic has a full chapter in Statistics Made Simple, with 1,569 worked practice questions in the bundle.Statistics Made Simple Complete Bundle — Textbook + 1,569 Practice Questions
Get it for $16