
If p-values still feel slippery after this, the cure is repetition on real numbers. The Statistics Made Simple Practice Questions workbook has over a hundred questions on hypothesis testing alone, each with a fully worked answer.
Statistics · Inference
What a P-Value Actually Means (And the Three Things It Doesn’t)
The most used and most misunderstood number in science. If you can state what it really means, you’re ahead of a frightening number of published researchers.
You ran a test. It gave you p = 0.03. You wrote “significant” and moved on.
But what does 0.03 actually claim? Ask five undergraduates and you’ll get five answers, and at least four will be wrong — not because they’re careless, but because the p-value is defined backwards from how intuition wants to read it.
This post gives you the one correct definition, the three seductive wrong ones, and enough understanding that you’ll never write “the p-value proves…” again.
The definition, said carefully
🔑 Key term
P-value — the probability of observing data at least as extreme as yours, assuming the null hypothesis is true.
Read the italics. The p-value is calculated in a hypothetical world where the null is true — where there’s no effect, no difference, nothing going on. It asks: if nothing were happening, how surprising would my data be?
A small p-value means your data would be surprising in a world of no effect. That’s evidence against the null — but it is not, and cannot be, the probability that the null is true. It assumed the null was true to get started. It can’t then turn around and tell you whether that assumption was right. That would be circular.
Chapter 11 of Statistics Made Simple works through p-values from first principles, including a deliberately borderline example at p = 0.053 to show why the 0.05 line is a convention rather than a law of nature.
💡 Insight — the courtroom analogy
Think of a trial. The null hypothesis is “innocent.” The p-value asks: if the defendant were innocent, how unlikely is the evidence we’re seeing?
A tiny p-value is like a mountain of damning evidence — hard to explain if they’re innocent. But notice: it never tells you the probability they’re innocent. And a jury that fails to convict returns “not guilty,” never “innocent.” Failing to reject the null is an acquittal, not a declaration of innocence. That distinction runs through all of hypothesis testing.
The three things it does NOT mean
⚠ Misreading 1
“p = 0.03 means there’s a 3% chance the null is true.” No. The p-value is computed assuming the null is true, so it can’t be the probability of that assumption. The probability the null is true is a different quantity entirely, and getting it requires Bayesian reasoning and a prior.
⚠ Misreading 2
“p = 0.03 means there’s a 3% chance my result was due to chance.” No. Your result already happened. The p-value is about the probability of data like yours in a null world — not the probability that chance produced your specific finding.
⚠ Misreading 3
“p = 0.03 means a 97% chance the alternative hypothesis is true.” No. It says nothing about the probability of the alternative. p and (1−p) are not the probabilities of two hypotheses. This is the same error as the first, wearing a different hat.
All three share one root: they treat the p-value as a statement about hypotheses, when it’s a statement about data. Fix that and all three dissolve.
Significant doesn’t mean important
“Statistically significant” is a technical phrase that has nothing to do with the everyday meaning of “significant.” It means “unlikely under the null” — not “big,” not “important,” not “worth acting on.”
With a large enough sample, an utterly trivial effect becomes statistically significant. A new teaching method that raises test scores by 0.2 points on a 100-point scale will clear p < 0.001 given 50,000 students — and be completely pointless. Significance measures precision, not size. Always report the effect size alongside the p-value, or you’ve told half the story.
💡 Insight — the 0.05 threshold is a convention, not a law
p = 0.049 gets a star; p = 0.051 doesn’t. Are those two results meaningfully different? No. They’re essentially identical evidence, sitting on opposite sides of an arbitrary line that Ronald Fisher suggested casually in 1925 and the profession then treated as sacred.
Treat p-values as a continuous measure of evidence, not a pass/fail gate. “p = 0.06” is not “no effect” — it’s “moderate evidence that didn’t quite clear an arbitrary bar.”
📊 Case study — why a journal banned the p-value
In 2015, the journal Basic and Applied Social Psychology did something startling: it banned p-values from its pages entirely. The editors had watched too many authors use “p < 0.05” as a magic phrase that substituted for thinking.
The following year the American Statistical Association — the field’s own governing body — issued a formal statement warning that p-values are routinely misused, and that “a p-value near 0.05 taken by itself offers only weak evidence against the null.”
When the discipline that invented a tool publishes a warning label for it, that’s worth noticing. The p-value is useful. It is also, more than almost any number in science, abused — and the abuse is a big part of why so many published findings fail to replicate.
Practice questions
Q1. A study reports p = 0.02. Write a one-sentence correct interpretation.
Q2. A student writes: “p = 0.20, so there’s an 80% chance our drug works.” Identify the error.
Q3. Study A: effect = 0.1 units, p < 0.001, n = 40,000. Study B: effect = 12 units, p = 0.08, n = 25. Which result is more important, and which is more statistically significant?
Q4. A researcher runs 20 independent tests on unrelated variables, all with no true effect, using α = 0.05. Roughly how many “significant” results should they expect by chance?
Worked answers
A1. “If the null hypothesis were true, there would be a 2% probability of observing data at least as extreme as ours.” Note what’s absent: any claim about the probability the null is true, or that the effect is real.
A2. Two errors, actually. First, p is not the probability the alternative is true, so “80% chance it works” doesn’t follow. Second, p = 0.20 is weak evidence against the null — the data are quite compatible with no effect. The student has inverted the meaning: a high p-value is evidence for caution, not confidence.
A3. Study B has the more important effect (12 units is large and potentially meaningful) but it’s not statistically significant at 0.05, because n = 25 is too small to be sure. Study A is highly significant but its effect (0.1 units) is trivial — significance bought by a huge sample. This is the significance-vs-importance split in one comparison: never confuse the two.
A4. About one. With α = 0.05, you expect a false positive 5% of the time, and 5% of 20 is 1. This is why running many tests and reporting only the significant one (“p-hacking”) manufactures findings from pure noise — and why pre-registering your hypotheses matters.
The short version
• p = P(data this extreme | null true). Not P(null true).
• It’s a statement about data, not about hypotheses.
• Significant ≠ important. Report the effect size.
• 0.05 is a convention, not a law. Treat p as continuous evidence.
• Run enough tests and something clears 0.05 by luck alone.
• It’s a statement about data, not about hypotheses.
• Significant ≠ important. Report the effect size.
• 0.05 is a convention, not a law. Treat p as continuous evidence.
• Run enough tests and something clears 0.05 by luck alone.
Next, see how this logic builds into a full test in setting up null and alternative hypotheses and how the two ways of being wrong get named in Type I vs Type II errors.
Every worked example in the Statistics Made Simple bundle was verified by independent computation before publication, so the output you read is the output you will see.
References
1. Wasserstein, R.L. & Lazar, N.A. (2016) “The ASA Statement on p-Values: Context, Process, and Purpose,” The American Statistician, 70(2), pp. 129–133.
2. Greenland, S. et al. (2016) “Statistical tests, P values, confidence intervals, and power: a guide to misinterpretations,” European Journal of Epidemiology, 31(4), pp. 337–350.
The p-value gets a whole careful chapter in Statistics Made Simple.
Because the misconception is nearly impossible to remove once it sets — so we take it slowly, the first time.
Get both books — $16, save $5 →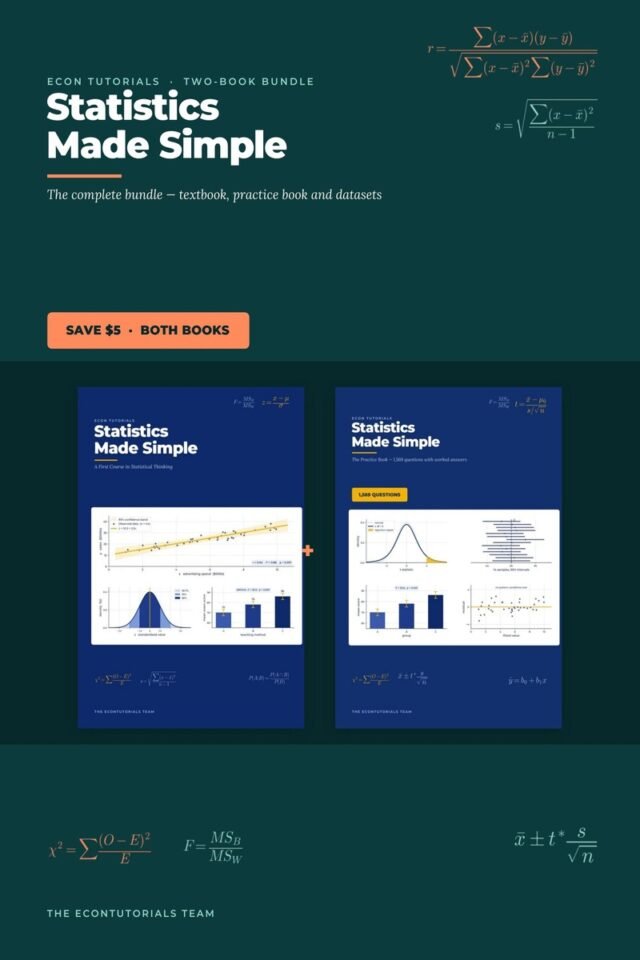
This topic has a full chapter in Statistics Made Simple, with 1,569 worked practice questions in the bundle.Statistics Made Simple Complete Bundle — Textbook + 1,569 Practice Questions
Get it for $16