
This article includes the objectives of explaining Indifference curve characteristics. In our last article, we defined and graphically explained the concept of the indifference curve.
Indifference maps, curve shapes and the special cases examiners love to test are covered in the Economics Made Simple Complete Bundle — textbook, practice questions with mark schemes, flashcards and 100 case studies.
Downward or upward indifference curve?
The Indifference curves slope downward to the right. But what if they sloped upward? And why don’t they?
Well! If they sloped upward, they would reject the assumption that more is recommended than less.
Because at some points that, had more of both goods would be indifferent to a basket with less of both goods.
Indifference Map
To describe preferences for all combinations of goods/services, we have a set of indifference curves –
And set of Indifference Curves is called an Indifference Map.
Each indifference curve in the map shows the market baskets among which the person is indifferent.

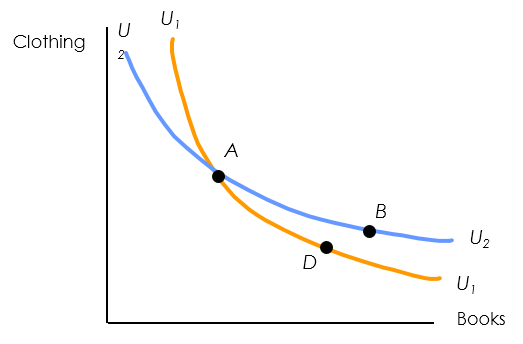
Indifference curves cannot intersect. Why?
Now the Indifference maps give more information about shapes of indifference curves.
Indifference curves cannot cross. If it does, it goes against the assumption that more is better.
But what if we assume they can cross?
Next topic is the Marginal Rate of Substitution=MRS