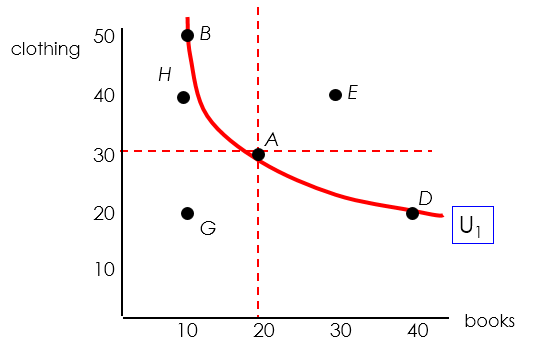
We discussed consumer choice/preference in our previous article where we talked about how consumer preference can be represented graphically using indifference curves.
This article will provide all the details related to an Indifference curve that explains the behavior of a consumer who is indifferent between the bundle of goods it prefers. By definition,
An indifference curve represents all combinations of bundles of good (basket of good) that the person is indifferent to ( provide the same level of satisfaction).
So a person is equally satisfied with either choosing bundles of Good say, X or the bundle of goods say Y, the utility or satisfaction would be the same.
Note that we are not considering the price or cost of the good at the moment that may affect our choice.
Indifference curves, their properties and how they combine with the budget line are covered with full diagrams in the Economics Made Simple Complete Bundle — textbook, practice questions with mark schemes, flashcards and 100 case studies.
Indifference Curve Graph
Let us comprehend the concept of Indifference curve with a graphical example:
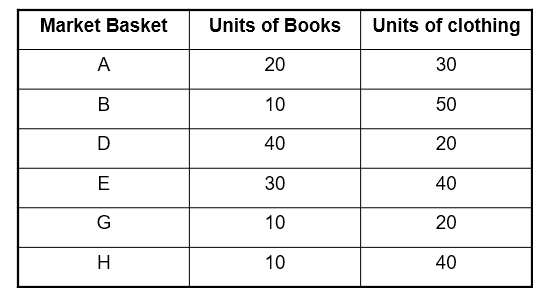
Graphing the points with one good on the x-axis and one good on the y-axis.
Plotting the points, we can make some quick observations about preferences where more is better than less.
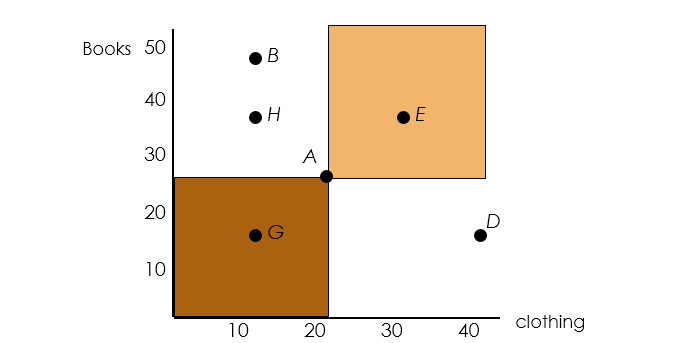
Interpretation of the graph:
If you notice the graph given below, you will find points such as B & D that has a higher level of one good but less of another compared to the point A.
A consumer must decide they are indifferent between B, A and D.
When we connect these points, we can see a downward sloping indifference curve.
Any market basket of an indifference curve when away or upward is preferred to any market basket that lies on the indifference curve.
Also, points on the curve are preferred to points below the curve.