
Preferences do not explain all of consumer behavior. There are probably a lot of other factors as well. Budget constraints also limit an individual’s ability to consume in light of the prices they must pay for various goods and services. In other words, a consumer need to select the best possible goods or market basket in the limited income that it has.
By the title Budget Constraint, we mean “the constraints that consumers face as a result of limited Income”.
Budget Line:
A budget line is all the possible combinations of of goods for which the total amount of money spent is equal to income.
Let us explain the definition by an example: Let F equal the amount of food purchased, and C is the amount of clothing:
- Price of food = Pf
- Price of clothing = PC
Then PfF is the amount of money spent on food, and PCC is the amount of money spent on clothing.
The Budget line than can be written:

All income is allocated to food (F) and/or clothing (C) . If we look at the definition it says in the last phrase as “TOTAL AMOUNT OF MONEY SPENT IS EQUAL TO INCOME” which we can see in the above equation of the budget line after the combination of Food and clothing.
Budget constraints, the budget line and consumer optimisation are covered with full diagrams and exam questions in the Economics Made Simple Complete Bundle — textbook, practice questions with mark schemes, flashcards and 100 case studies.
Graphical Representation of the Budget Line:
Since different choices of food and clothing can be calculated that uses all income. These choices can be graphed as the budget line.
Example: Assume income of $80/week,
- PF = $1
- PC = $2
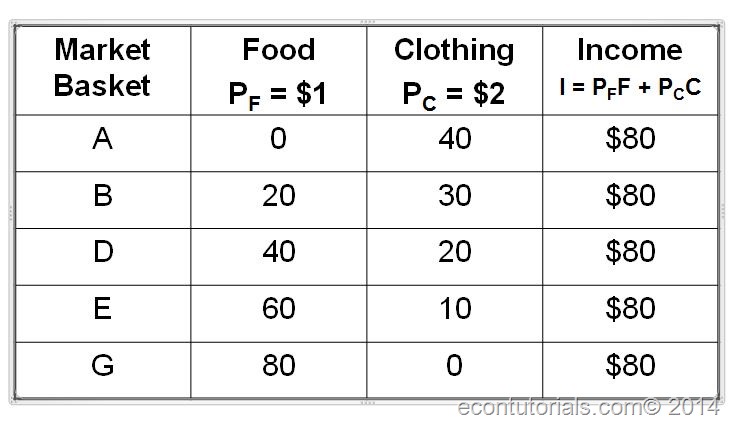
Using the above data in graphical Analysis we have:

Interpretation of the Graph:
The vertical intercept, I/PC, illustrates the higher amount of C that can be bought with income I. The horizontal intercept, I/PF, illustrates the high amount of F that can be bought with income I.
As consumption moves along with the budget line from the level intercept, the consumer spends less on one item and more on the other.(Obviously you wont prefer being naked for the sake of food. You would certainly forgo less and less of clothing to acquire the additional unit of Food).
Additionally, the slope of the line measures the relative cost of food and clothing. Furthermore, the slope is the negative of the ratio of the prices of two goods.The slope indicates the rate at which the two goods can be substituted without changing the amount of money spent on both of them. We can rearrange the budget line equation to make this more clear.

In the next topic we will describe how Incomes and Price Changes effect the Budget line.