
Standard deviation is the single most-used spread statistic in the whole subject, and dividing by n instead of n−1 is the single most common mistake made calculating it. The Statistics Made Simple Practice Questions workbook has a full chapter of drills built around exactly this distinction.
Statistics · Variability
What is Standard Deviation?
The most widely used measure of spread — how it works, how to calculate it, and why it matters more than the range.
The mean tells you where the centre of your data is — but it tells you nothing about how spread out the data is. Two classes can have the same average exam score of 65 but very different distributions: one where every student scored between 60 and 70, and another where scores ranged from 20 to 100. The statistic that captures this spread is the standard deviation.
📘 Key Term
The standard deviation (σ or s) measures how much individual data values deviate from the mean on average. A low standard deviation means data points cluster closely around the mean; a high standard deviation means they are spread widely. It is always expressed in the same units as the original data.
Chapter 4 of Statistics Made Simple works through population versus sample standard deviation on the same dataset, showing exactly why Bessel’s correction is needed.
Population vs Sample Standard Deviation
| Population (σ) | Sample (s) | |
|---|---|---|
| Formula | σ = √[Σ(x−μ)² / N] | s = √[Σ(x−x̄)² / (n−1)] |
| Denominator | N (all values) | n−1 (Bessel’s correction) |
| Used when | You have data on the entire population | You have a sample and want to estimate σ |
Step-by-Step Calculation
Dataset: 4, 7, 13, 2, 9 (n = 5)
Step 1: Calculate the mean: x̄ = (4+7+13+2+9)/5 = 35/5 = 7
Step 2: Find deviations from mean: −3, 0, +6, −5, +2
Step 3: Square each deviation: 9, 0, 36, 25, 4
Step 4: Sum of squares = 74
Step 5: Divide by (n−1) = 4: Variance = 74/4 = 18.5
Step 6: Take square root: s = √18.5 = 4.30
💡 Key Insight
The standard deviation is the square root of the variance. We use the square root to return to the original units — if data is in pounds sterling, variance would be in pounds squared (meaningless), but standard deviation is back in pounds. This is why standard deviation is more interpretable and more widely reported than variance.
The Empirical Rule (68-95-99.7 Rule)
For data that follows a normal distribution, standard deviation allows powerful probabilistic statements:
📊 68% of data falls within 1 standard deviation of the mean (μ ± σ)
📊 95% of data falls within 2 standard deviations of the mean (μ ± 2σ)
📊 99.7% of data falls within 3 standard deviations of the mean (μ ± 3σ)
⚠️ Common Error
Students often divide by n rather than (n−1) when calculating a sample standard deviation. The (n−1) denominator — called Bessel’s correction — corrects for the fact that a sample tends to underestimate the population spread. Always use (n−1) for sample data; only use N for a full population census.
Statistics Made Simple
Every spread statistic, built from scratch.
246 pages of explanation and 1,569 practice questions with fully worked answers — variance, standard deviation, and the empirical rule all covered with matched drills.
Q1. A sample of 5 student test scores is: 72, 85, 90, 68, 75. Calculate the sample standard deviation. [5 marks]
Answer: Mean = (72+85+90+68+75)/5 = 390/5 = 78. Deviations: −6, +7, +12, −10, −3. Squared deviations: 36, 49, 144, 100, 9. Sum = 338. Variance = 338/(5−1) = 338/4 = 84.5. Standard deviation = √84.5 = 9.19. This means scores typically deviate from the mean by about 9.19 marks.
Getting the population-vs-sample distinction automatic takes repetition. The Statistics Made Simple Practice Questions workbook has dozens of standard deviation problems with fully worked solutions.
References
1. Moore, D.S., McCabe, G.P. and Craig, B.A. (2021) Introduction to the Practice of Statistics. W.H. Freeman.
2. Triola, M.F. (2022) Elementary Statistics. Pearson.
3. Field, A. (2018) Discovering Statistics Using IBM SPSS Statistics. SAGE.
4. Freedman, D., Pisani, R. and Purves, R. (2007) Statistics. W.W. Norton.
5. Ross, S.M. (2020) Introduction to Probability and Statistics for Engineers and Scientists. Elsevier.
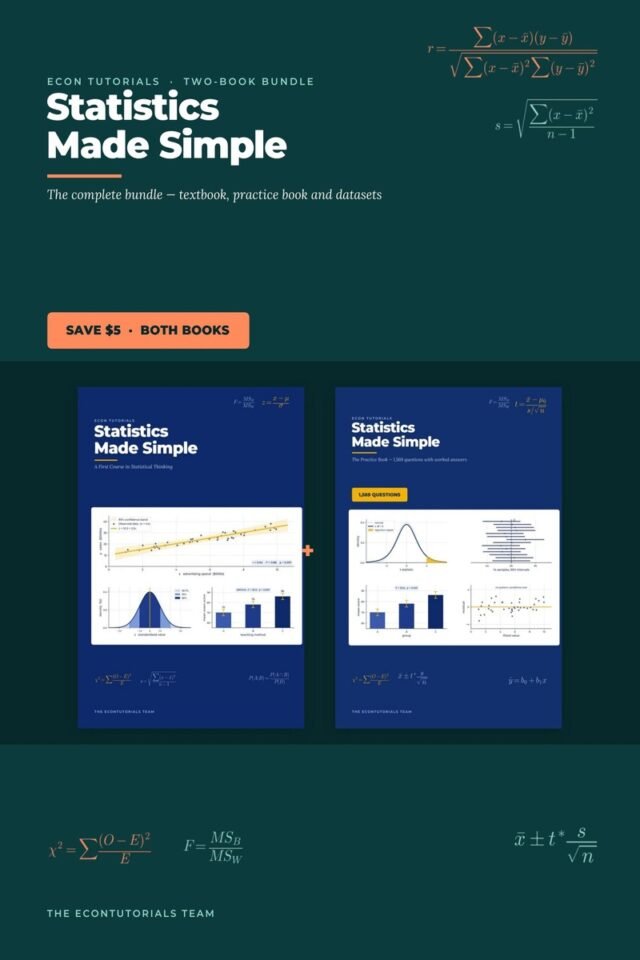
This topic has a full chapter in Statistics Made Simple, with 1,569 worked practice questions in the bundle.Statistics Made Simple Complete Bundle — Textbook + 1,569 Practice Questions
Get it for $16