By Definition, Dummy variables are Indicator, Categorical and Qualitative variables that are used to quantify the qualitative, nominal scale variables by giving them the value of 0 and 1.
In simple words, we come across variable which are non-numerical in their attributes or you may say qualitative in nature. For regression, such variables are to be given a value which is done in the form of a dummy variable. This is the reason that a dummy variable is also called an indicator or categorical variable which actually indicates all those non-numerical categories by giving them the value of 0 or 1.
Note: Qualitative variable are nominal scale variable which have no specific numerical value For example: Gender, politics, Race, religion, region, union, children, party, nationality, residency, country, occupation, profession etc
Reference category in Dummy variable
- The category that has the value of 0 is called the reference category, Benchmark or comparison category.
- All the comparisons of the dummy variable are made in relation to its reference category
- So if there are many dummy variables, we must not forgot to keep an account of the reference category of each of the dummy variable during the interpretation.
Dummy variable example in Eviews
Let me explain how can we use dummy variable in a function and how do we interpret the terms written in that function. For example: Using a wage function example:
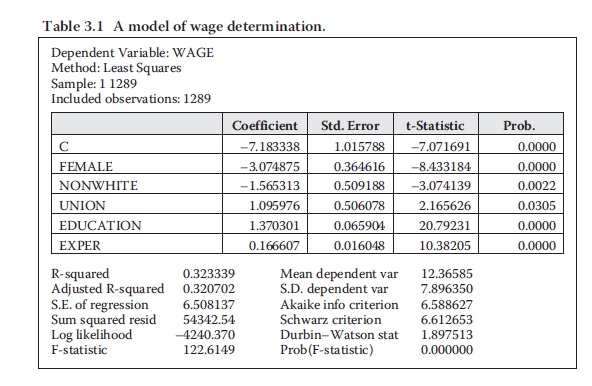
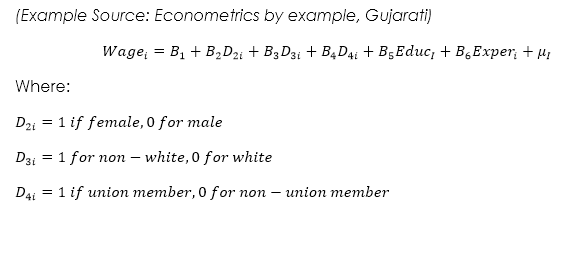 Now these are the dummy variables. When we run a regression of this equation in eviews, we will come up with a solution somewhat like this:
Dummy variables and the Intercept
There are some important point you need to remember before you use regression analysis with dummy variables.
- If in an equation we have an intercept, the amount of dummy variable must be one less than the amount of each qualitative variable.
- If in case we don’t have an intercept in the model, than the dummy variables must equal the amount of the qualitative variables available in the equation. This means that the intercept itself acts as a regressors in the model whose value is always one.
- Dummy variable interacts with both quantitative and qualitative variables but remember that an introduction of each dummy variable is at the cost of consuming each degree of freedom in the model.
Dummy Variable Interpretation
How would we interpret the female dummy coefficient?
Remember that we explained that whenever we are interpreting the dummy variable, we have to refer to the benchmark or comparison category.
So the female coefficient of -3.07 means that “The average hourly salary of a female is less than $3.07 compared to the average salary of a male worker (the benchmark category)
How to interpret the Nonwhite Worker?
A non-white worked with a coefficient of -1.56 means that the average hourly wage of a nonwhite worker is as low as $1.57 compared to the average hourly salary of a white worker (the benchmark category.
Note: Each dummy variable must be interpreted with its benchmark category mentioned before in the model.
Importance of P-value:
In the above example another way of understanding the importance and relevance of how good the data is that is being run by regression can be seen by the P-value. We can see that all the variable have 0 or close to 0 values which means that the dummy coefficients that we just interpreted are highly significant.
Differential Intercept Dummies
These dummy coefficients in the above example are called differential intercept dummies as they show the difference in the intercept values of the category that gets the value of one compared to their benchmark category which has a value of zero.
To make it more easier to understand , remember that the dummy variables which are attached to the coefficients are called “Differential Intercept dummies”
Common intercept Value: How to interpret the intercept in Dummy variable equation?
In the above example of wage function, the regression solution gave us the intercept value of -7.18? How do we interpret this value?
Keeping an account of all the benchmark category with the value of Zero, the intercept can be interpret as “it is the average hourly wage rate of White (0), Male (0), and non-union worker (0).Or in other words, it is the common intercept value that refers to all the benchmark categories.