Shifts in Aggregate Demand Curve

January 15, 2016

We just assumed that the Monetary and fiscal policy variable are kept constant when deriving the Aggregate Demand Curve. So any changes made in the following variable will shift the curve.

  1. Money Supply
  2. Consumption (household spending)
  3. Investment
  4. Government Expenditure
Study smarter
Nail every AD-AS shift with clear diagrams and exam questions. The Economics Made Simple complete bundle brings the textbook, case studies and flashcards together at a discount for AP and Cambridge A-Level students.

Graphically

An increase in the Supply of Money at a given price level will shift the Aggregate Demand curve Upwards (or right ).Another example can be explained graphically as :
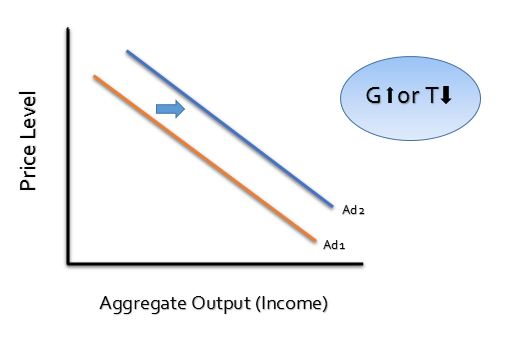
shift in aggregate demand curve

Similarly in case of Government expenditure there would be an increase in Aggregate Demand or a rightward shift if the Govt expenditure increase. Comparatively with regard to an increase in Taxes there would be a downward (leftward shift in the aggregate demand curve as that would decrease the consumption level of individuals that as a result would decrease the overall output of the economy.

See it in the real world
How do fiscal stimulus and monetary easing shift real economies? Our 100 Real-World Case Studies collection shows these shifts at work with expert analysis.

Read the following complete lecture about deriving the Aggregate Demand Curve

Deriving the Aggregate Demand Curve

Go deeper
For the full AD-AS framework and macroeconomic equilibrium — with worked exam questions — see Economics Made Simple, our 900-page supplementary guide for AP and Cambridge A-Level students.

Related Posts

Skewness and Kurtosis: Measuring the Shape of a Distribution

Two datasets can share the exact same mean and standard deviation and still look completely different when plotted — because mean and variance say nothing about the shape of a distribution. Skewness and kurtosis fill that gap, and they matter far beyond the...

Skewness and Kurtosis: Measuring the Shape of a Distribution

Two datasets can share the exact same mean and standard deviation and still look completely different when plotted — because mean and variance say nothing about the shape of a distribution. Skewness and kurtosis fill that gap, and they matter far beyond the...