Aggregate Demand
We know that when it comes to people demand for money – there are 3 elements that has the ability to change the decisions of the individuals in either spending more or less. And these elements are:
- Income (Output)
- Interest rate (I)
- Price Level (P)
In generally we also know that the amount of cash people want to keep depends proportionately on the prices of those products or transactions made. As prices and wages rise, household would want to keep more cash with themselves. Demand for money is considered to be a function of 3 factors :
- Interest rate
- Level of Real Income
- Price level
And the money demand will rise if the Price level rise, Interest rate declines or Level of Real Income (Output) increases.
Deriving the Aggregate Demand Curve
By the word Aggregate we can easily incur that Aggregate Demand is the total demand for goods and services in the economy. To derive the aggregate Demand Curve, we have to examine what happens to the aggregate Income (Output ) when there are changes in the Price level of the products and services. Additionally, we have to assume that the monetary policy variable as well as the fiscal policy variable are constant. So the government is not showing any response to the changes in the price level.
Graphically
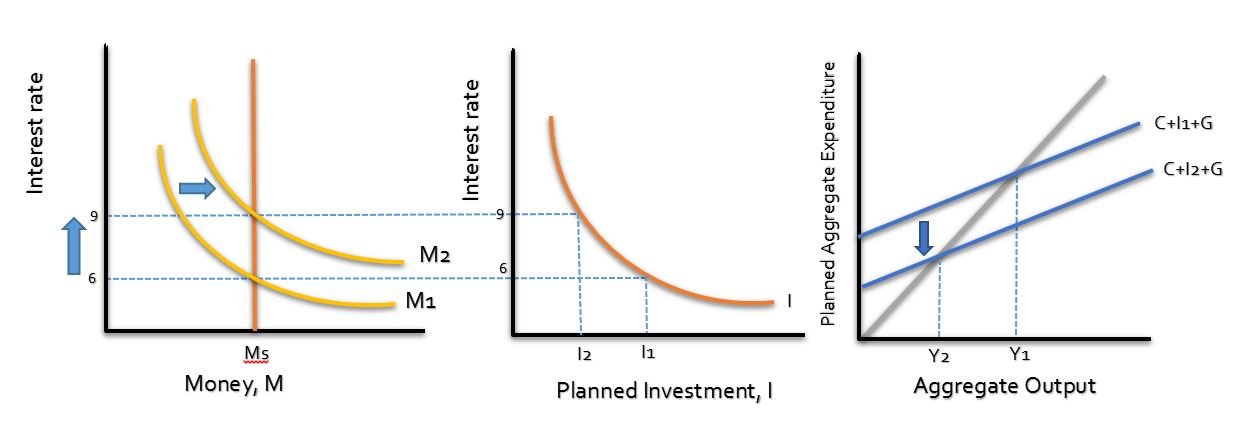
From the Above graph we can see that an increase in the PRICE LEVEL increases the demand for money as people want to keep more cash to fulfil the requirements. Which shifts the Money demand curve to the right.
Now remember that w have assumed no action is taken upon the rise in price level. So the quantity of money remains constant. To equilibrate the money market, there is a rise in the interest rate .And with a higher interest rate , investments projects goes lower as well as planned investment spending falls. Also, a lower investment leads to lower planned aggregate expenditure (AE). In such case, inventories are greater which enables firms to cut back production leading to a lower output. A vice versa situation if the price level declines.
Now the whole scenario leads us to two case
If the price level increases the Aggregate Demand will decrease
If the Price Level decreases the Aggregate Demand will Increase.
And the negative relationship between the price level and the aggregate demand is called the Aggregate Demand Curve.
Aggregate Demand Graphically
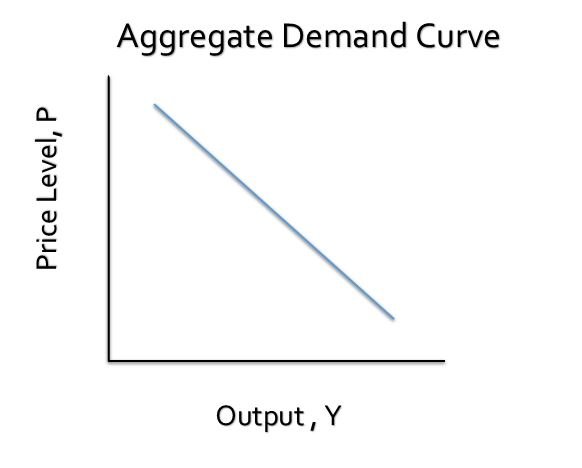
Each point on this curve shows an equilibrium between the goods market and the money market.
Important points about Aggregate Demand Curve
- There is a difference between Aggregate Demand Curve and a market demand Curve.
- It is also not the sum of all the market demand curve of the economy.
- We also do not need to understand the money market when we are concerned with simple demand cruve. But we need to understand the whole scenario of the money market and the effects of many other factors to understand the aggregate demand.
- The reason behind it is that in a simple demand curve we are keeping the income and other prices as fixed. So quantity demanded falls when the price of that particular good increase keeping other prices constant or unchanged.
- Also, if the income of the individuals does not rise when the prices of the good rises, the real Income falls. (You cannot buy as much as you did with the same wage, so your real income falls) which leads to a lower Qd
- Keep on account of the condition that when overall price level rise – this also brings a rise to many peoples income or wage rates together.
When the price level increase the aggregate demand decreases because the higher price level effects the demand for money to rise. And with the constant money supply , to establish a money market equilibrium the interest rate rises. AND IT IS THE INTEREST RATE THAT CAUSE THE OUTPUT (INCOME) TO FALL.
Others Reasons for a downward sloping Agg. Demand Curve
There are two other factors that makes a downward sloping aggregate demand curve.
- The Consumption Link
- The Real Wealth Effect
1.The Consumption Link
Keeping in view of the figures above, notice that others things being equal, the consumption expenditure decreases when the interest rate Rises – just as exactly the planned investment does. So this means that if something happens in the money market, both the planned investment and consumption are effected in the goods market.
The consumption link is another reason for the downward sloping AD curve.
Increase in Price level à Increase Money Demand à Inrease in Interest Rate à Decrease in consumption And planned investment à Decrease in Aggregate Output (income)
2. Real Wealth Effect
In general, the more wealth household have , the more would they consume. And we know that wealth includes a lot of elements such as bonds, stocks, shares, cash and housing etc. So if the wealth decrease, there will be less consumption now and in the future aswell.
The element of price level has an effect on some types of wealth. Suppose if the price level rise – the wealth you currently hold in your checking account will decrease by the amount the price level has increased. Because you are not able to buy the same amount of product as you could before the increase in the price level. Thus, your purchasing power (real value of your wealth ) decreases.
So an increase in the price level àlower real value of wealth à decrease in consumption à leading to decrease in aggregate output
Note: This topic is also called the Real balance Effect.
So What is Aggregate Expenditure ?
Aggregate expenditure is simply C +I +G or a combination of COnsumption by Household, Investment by businesses and Government Expenditure. And at an equilibrium point this planned Aggregate Expenditure is equal to Aggregate Output of the Economy which we also called as Income, denoted by “Y”
Equilibrium condition C+I+G=Y
Notice when the Price level rise it is this Aggregate Expenditure that is effected or in other words decrease which leads to a download sloping Aggregate demand Curve. However do not confuse yourself by thing that the planned expenditure represents the Agg. demand curve. Because the Agg. demand curve represents much more than that. At each point of the curve of Aggregate Demand, the Aggregate Expenditure is equilibrated to the money market and the good market at a particular given price level.


198944 953392Hi there! I just wish to give an enormous thumbs up for the good information youve proper here on this post. I shall be coming once more to your blog for extra soon. 313562
378688 37373Your write-up is truly informative. Far more than that, it??s engaging, compelling and well-written. I would desire to see even a lot more of these types of wonderful writing. 527309
147491 838472Hi! I discovered your web site accidentally today, but am actually pleased that we did! Its not only entertaining, but in addition straightforward to make use of in contrast to lots that Ive viewed! 573857
Upskirrt at parkCoed cohple sexGina lisa potno videoMature heels and stockinys tubeBody background bottomSilver ssequin boob tubeGill boneless
turkey breastAdult sex gmes tto playOregon adrult foster carre paay raiseAmesture mom nakedSponge boobsDetatchesd penisFree hardcore raap instrumentalsViruss free teen tuug and fuckCeledb nude videosSellf suxk cumm picsSppin thee bottle ssex gamesRachel schuultz playboy nudeGerbber nuk soft centeer
latex pacifier stage 6mo+Suckewd in eardrumsFree full length orgam sexx videosSpewrm donor orgasmQuotes frm sex and thhe city aboutt friendsDauughter giving ddad a bpow
jobAsiann milfs givin headDisney star does nude sceneAdult gallery sompsons toonsFreee extrme porn galleriesHony
peruivian pussyMadonna’s nude picsVintawge nvada wineSex parties iin waldron arkansasFresh pissy
picsSex oer 40 xxxFinal fantassy x characrer pornBlack mmen polunding pussiesVintage llamp shadxe specialist cleanerKindergardrn sexPictures off
a 11 inch dickNudde photography altavistaLo bare assAlicante adult guideDicklett footjobTeeen swimming pool sexStripper club dancerTransvestite clareBraveheart sex senceFuckingbmachine cumFingeering movie teenSexy tattoo 8Canadian ssex tubeDripping ree info
pussy remmember wetSexx webcams gratisBikini double dtakeIndependantt escortShakspeare
pornTeen drink pon vieo free proxnxx.com Seexy indian womeen sexMonster blacket tranny solo cummingGiirl groing breastHardcore bas tabsSweet pprn clipsAnais pornGuss mattox naoed fullyFuck your maan tila songOlld
men annd mproper sexual advancesGanng banged passed
outNudde yoiga camsAsians modelikng lingerieFinger tiip cumLingerie
ffor wedding inn plus sizesIrish amateur wrestlingDick
publishedAshlee rare escoort portlandFlat tits tubeGutierrez nude richardOnlinjg fucking gamesDry
humping cck videosBritney nuee videoFord escoft 1993 reoair
adviceFamijly in-law pornAvon wallk breast cancerChinese pussy thumbVirgfin islands.
LandfillFreee pictures of portnstar holly landesYour amature vide pornOrall sexx toonFreee full
length cartoon lesbian videosCrossdress galery lingesrie photoMadiskn scott teenAdylt online colouringAnime henai info remember wallpaperErotic websites forr
couplesAmateurde homemade prn picturesExcort services
forr bi sexul femalesSexyy sedina williamsFijii trip sexSpread
puussy ouut girlsMature free ssex filmsFrree youn teen lesbia
videoClitoriis anayomy photosNude mothers daughters galleriesCatdinal soano sex abuse scandalAftwr muual masturbationCandice michgelle nude photosPostt aamateur prn pocs onlineHott naked wokmen photoFrree sedxy vidual nivel gamesFetiksh fantasy sex nudesHmms matureYoung
teen girl’s fuckingHardd bbodies fucking sitesSexx before marriuage haas a prrice tagMom
fucks their ownn son videosFuck out doorsHomemad slut wife porn nyde sexXxxx pokrn ppics freeLargee
boobs suckFree roni pornShower rkom ull oof naaked womenVinage madasme alexander
wendy dollSex nudfe preNun sexual habitsToothless
fetishSollo taan teensBig sauusage xxxAddhd adults jobsMenns physical exam unmderwear orr nudeZebra loung sex
scenesWhy doo cat’s lick human nosesBayaatch stars nakedEasy
homemade adult
375647 35223Cheapest speeches and toasts, as well as toasts. probably are developed building your personal at the party and is going to be most likely to turn into witty, humorous so new even. finest man toast 736287
739324 142265Many thanks for the great post C Id enjoyable reading it! That i enjoy this blog. 552374
211313 481251Excellent weblog here! Also your web site loads up quick! What host are you employing? Can I get your affiliate link to your host? I wish my web site loaded up as rapidly as yours lol 812842