We have been discussing about Demand curve of product with changes in its price and Quantity Demanded depending on different Situation. Let us now be more concerned about Individual Consumer Demand Curve whose decision are affected by the limited budget it has. So let me explain how and why !
Such Demand Curves have two Important Characteristics:
- The status or position of Utility Change as the curve moves because of Price Changes. For Example: As Prices go down—–>Utility Increase because of buying more of that Good.
- In such Curves, the consumer Maximizes its utility by MRS=Px /Py . With this Condition we meant to describe that due to MRS as we move down along the curve, the utility for buying evey additional unit of X for Y decreases.
Price Consumption Curve
A curve which is made after various combinations of utility Maximization because of a changes in the Price of One Good while the other remains constant.
Graphically:
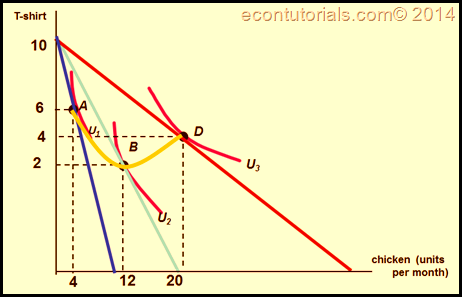
As discussed earlier, a Decrease in the Price of Chicken has increase the consumption level of the Consumer.We have a movement in the budget line and each Indifference Curve is Tangent to the Budget line having consumers best possible decision for the consumption of T-shirts and Chicken with further decrease in Price.
The Point A,B and D after combining Makes the Price Consumption Curve. This shows that with each decrease in the Price of the Product the Consumer changes its decision for the level of consumption of Chicken.
Assignment for you : If this is our Price Consumption Curve. How would an Income Consumption curve be ? Let me provide a hint before you work over it. As income changes, our budget line shifts (which it doesn’t in the Price Consumption Curve as its only the Price of Chicken that changes and not income). Combine the points of Indifference curve tangent to the Budget line which will Produce an Income Consumption Curve.
Up next: Normal Versus Inferior Goods


Alright, so logging in to PlayKaro can be a pain sometimes, right? Luckily their site is straightforward. No BS. Just a simple login. If you’re having trouble, check it out: playkarologin
Yo, heard about PlayKaro365 from a buddy. Checked it out – pretty decent! Simple interface, easy to navigate. Could use a few more game options IMO, but overall solid. Check it out: playkaro365
Investigating TopX Casino Affiliate programs. Looking to see if this is a good way to try and generate some extra income. Gotta investigate carefully! topxcasinoaffiliate
951125 925136Wow! This could be 1 certain of the most useful blogs Weve ever arrive across on this topic. Truly Fantastic. Im also an expert in this subject therefore I can recognize your hard work. 634012