
By definition, demand is the ability and willingness of a consumer to buy or purchase a particular product.
Remember that a demand curve is explained differently than the concept of demand itself. Do not confuse yourself with both.The Demand curve is the relationship between the Price and Quantity Demanded.
More related posts:
The Quantity Demanded vs the Demand Curve
Students or people without an economic background often mistake the demand with the quantity demanded.
“Demand” denotes consumer’s willingness and ability to buy a product.
“Quantity Demanded” is the amount of a product that a consumer is willing and able to buy.
The demand curve indicates the quantity of a good that consumers are willing to buy as the price per unit changes.Mathematically, this relationship can be written in the form of an equation as :

The equation explains that the demand is a function of the price of the product. In value terms, demand is equivalent to the quantity demanded multiplied by its price.
[bctt tweet=”In value terms, demand is equivalent to the quantity demanded multiplied by its price. ” username=”econotutorial”]
Demand Graph
Graphically, demand is a downward sloping curve labeled as “D”. The concept behind the downward sloping demand curve is called the LAW OF DEMAND.The consumer buys more unit of the good when the price is low and fewer units when the price increases. In other words, demand is a negative function of the price. This phenomenon is universally called the Law of Demand.

Factors Influencing the Demand curve
There are many factors that can affect the shape of the demand curve in addition to the price of the product. Some of these factors are:
- Consumer’s Income;
- Prices of other goods (Substitutes);
- Prices of related goods (Complementary);
- Tastes and Preferences of Consumers;
- Number of Consumers in the Market;
- Consumer Expectations.
Check out the detailed course of Economics in Udemy, Coursera, and The Great Courses
A shift of demand curve versus movement along the demand curve
There is a considerable difference between a shift in the demand curve and movement along the demand curve.
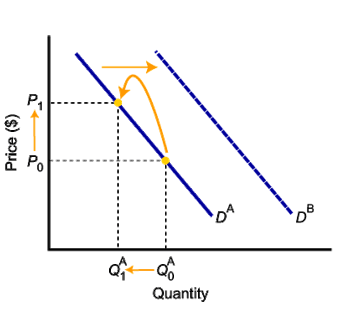 When we use the phrase of change in demand, we are talking about the shift in the demand curve caused by factors other than price. In contrast, when we are talking about change in quantity demanded, we are intending a movement along the curve due to price changes (keeping other factors constant)
References:
- Samuelson, P. A., Nordhaus, W. D., Samuelson, P. A., & Samuelson, P. A. (1998). Economics. Boston, Mass: Irwin/McGraw-Hill.
- Mankiw, G. (2013). Macroeconomics. 8th ed. Houndmills: Palgrave Macmillan.