The effect of Shifts in Demand in Monopoly

June 28, 2015

A Monopolistic market has no Supply curve

The reason behind it the NO SUPPLY CURVE is that the monopolist output decision depends not only on Marginal cost but also on the Shape of Demand Curve. Note that the shape of demand curve do not tell us Price and Quantity that reaches to a competitive supply curve. Instead, shifts in demand curve can lead to

Study smarter
Monopoly pricing, why a monopolist has no supply curve and every market structure are covered with clear diagrams and exam questions in the Economics Made Simple complete bundle — textbook, case studies and flashcards at a discount for AP and Cambridge A-Level students.

1. Changes in Price with no change in Output

2. Change in output with no change in Price

3. Changes in Price and Output both
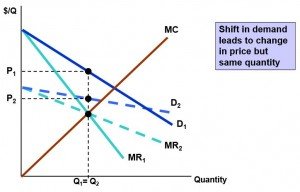
change in price monopoly

Graphically

The Demand Curve D1 shifts to D2. And the new marginal revenue curve MR2 intersects marginal cost at the same point as old marginal revenue curve. Therefore, the Profit maximizing output remains the same although the Price shifts from P1 to P2(downwards)
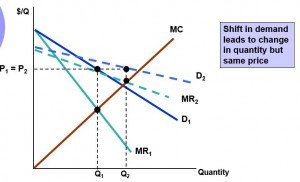
 

change in quantity monopoly


In this case, the marginal revenue MR2 intersects the Marginal cost curve at a higher output level Q2. But we can also from the curve that the demand is elastic so the price remains the same.


Instead of a competitive industry which supplies a specific quantity at every price, a monopoly does not have any such relationship and it dependent over the shifts in demand.  

See it in the real world
How monopolists actually set price and output shows up across real industries. Our 100 Real-World Case Studies collection works through real monopoly and pricing cases with expert analysis.
Go deeper
For the full treatment of monopoly, marginal revenue and why the supply curve disappears — with worked exam questions — see Economics Made Simple, our 900-page supplementary guide for AP and Cambridge A-Level students.


Related Posts

Profit Maximisation with Calculus: First and Second Order Conditions

Setting the derivative to zero finds a flat point – but flat points can be maxima or minima, and choosing wrong reverses your answer. The first and second order conditions explained, with a worked cubic profit function where the FOC alone gives two candidates and only the SOC tells them apart.

Paired vs Independent t-test: How to Tell Them Apart

Same test name, completely different setups. One question decides it: is each value in group A naturally linked to a specific value in group B? Why the paired test cancels between-person noise and is far more powerful when it applies — and how picking wrong quietly throws away half your statistical power.

Z-Scores and the Normal Distribution: A Plain-English Guide

A z-score is how many standard deviations a value sits from the mean — a universal ruler that lets you compare across any scale. The z = (x−μ)/σ formula, the 68–95–99.7 rule, the three-step method for “what percentage scored above X?”, and the direction error that catches everyone.