
The shapes of indifference curves describe how a consumer is willing to substitute one good for another
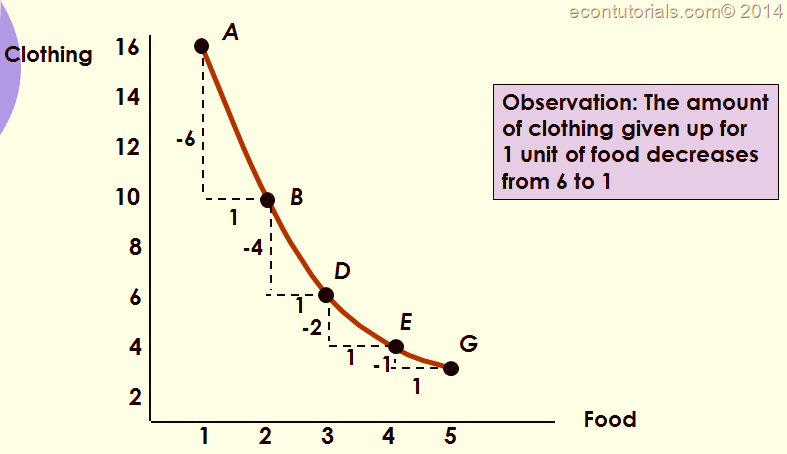
In the Graph above:
- A to B, gives 6 clothing to get 1 food
- D to E, gives 2 clothing to get 1 food
- The more clothing and less food a person has, so the more clothing they will give up to get more food.
The marginal rate of substitution, diminishing MRS and the tangency condition are covered with full derivations in the Economics Made Simple Complete Bundle — textbook, practice questions with mark schemes, flashcards and 100 case studies.
Marginal Rate of Substitution
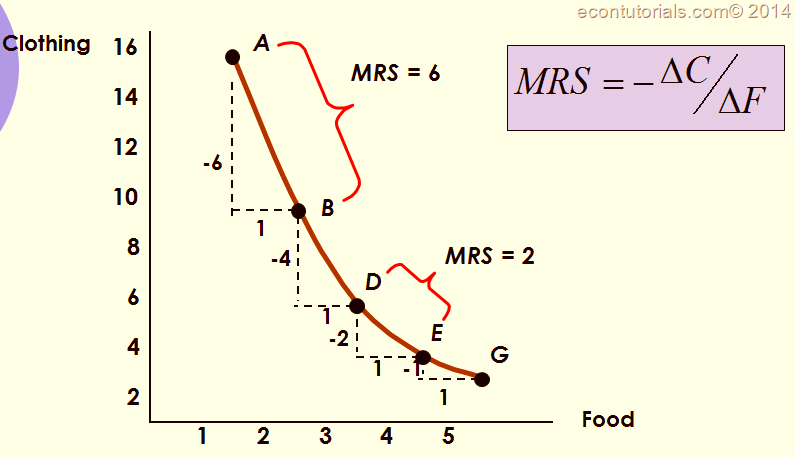
We measure how a person trades one good for another using the Marginal rate of substitution (MRS).
Marginal Rate of Substitution provides or quantifies the amount of one good a consumer will forgo to obtain more of another good.
It is measured by the help of slope of the indifference curve.
Convexity of Indifference Curve
As we have already discussed. Indifference curves are convex . But why ?
As more of one good is consumed, a consumer would prefer to give up fewer units of a second good so as to get extra or additional units of the first good.
Consumers generally prefer a balanced market basket. As you would not want to give up all of one good and get the second one or vice versa.
Diminishing Marginal Rate of Substitution
As it is discussed above that you would gradually prefer giving up less and less units of the second good. So :
The MRS decreases as we move down towards the indifference curve. So going along an indifference curve there is a diminishing marginal rate of substitution.
in the Graph above we can see that the MRS went from 6 to 4 to 1.
Two Polar Cases
Indifference curves with different shapes imply a different willingness to substitute. Two polar cases are of interest
- Perfect substitutes
- Perfect complements
Perfect Substitutes
Two goods are perfect substitutes when the marginal rate of substitution of one good is completely constant for the second good.
Example: a person might consider apple juice and orange juice perfect substitutes.They would always trade 1 glass of Orange Juice for 1 glass of Apple Juice.

Perfect Complements
Two goods are perfect complements when the indifference curves for the goods are in the form of right angles.
Example: If you have 1 left shoe and 1 right shoe, you are indifferent between having more left shoes only (So you must have one right for one left)
